Employee Voice: Create a Survey
Create a Survey
Overview
Surveys are data collection tools used to obtain specific information from individuals for analysis and reporting purposes. Employee Voice offers three options to create a survey:
- Custom Survey - create your own survey from scratch using questions you create or select pre-made questions from the question library.
- UKG Survey - use a template created by UKG industrial organizational (I-O) psychologists. These templates are built using the latest evidence-based framework in I-O psychology. They include a variety of question types and are organized with branching logic and follow-up questions.
- Mercer | Sirota Survey - use a template created by Mercer | Sirota, a nationally recognized survey provider with expertise in survey design and a robust normative database. These templates include rating questions, with industry and region specific, normative benchmark data from about six million individual data points.
To create a survey from scratch, review sections in the following order:
- Create Survey
- Configure Survey Design
- Configure Questions
- Configure Metrics
- Configure Tags
- Configure Benchmarks
- Configure Translations
- Configure HTML Variables
To create a survey using an Employee Voice template or a Mercer | Sirota template, review sections in the following order:
- Create Survey
- Select Survey Template
- Configure Survey Design
- Configure Questions
- Configure Metrics
- Configure Tags
- Configure Benchmarks
- Configure Translations
- Configure
Create Survey
The first step in creating a survey is to decide if you want to create the survey using a template or create the survey from scratch.
- From the Surveys page, select New Survey.
-
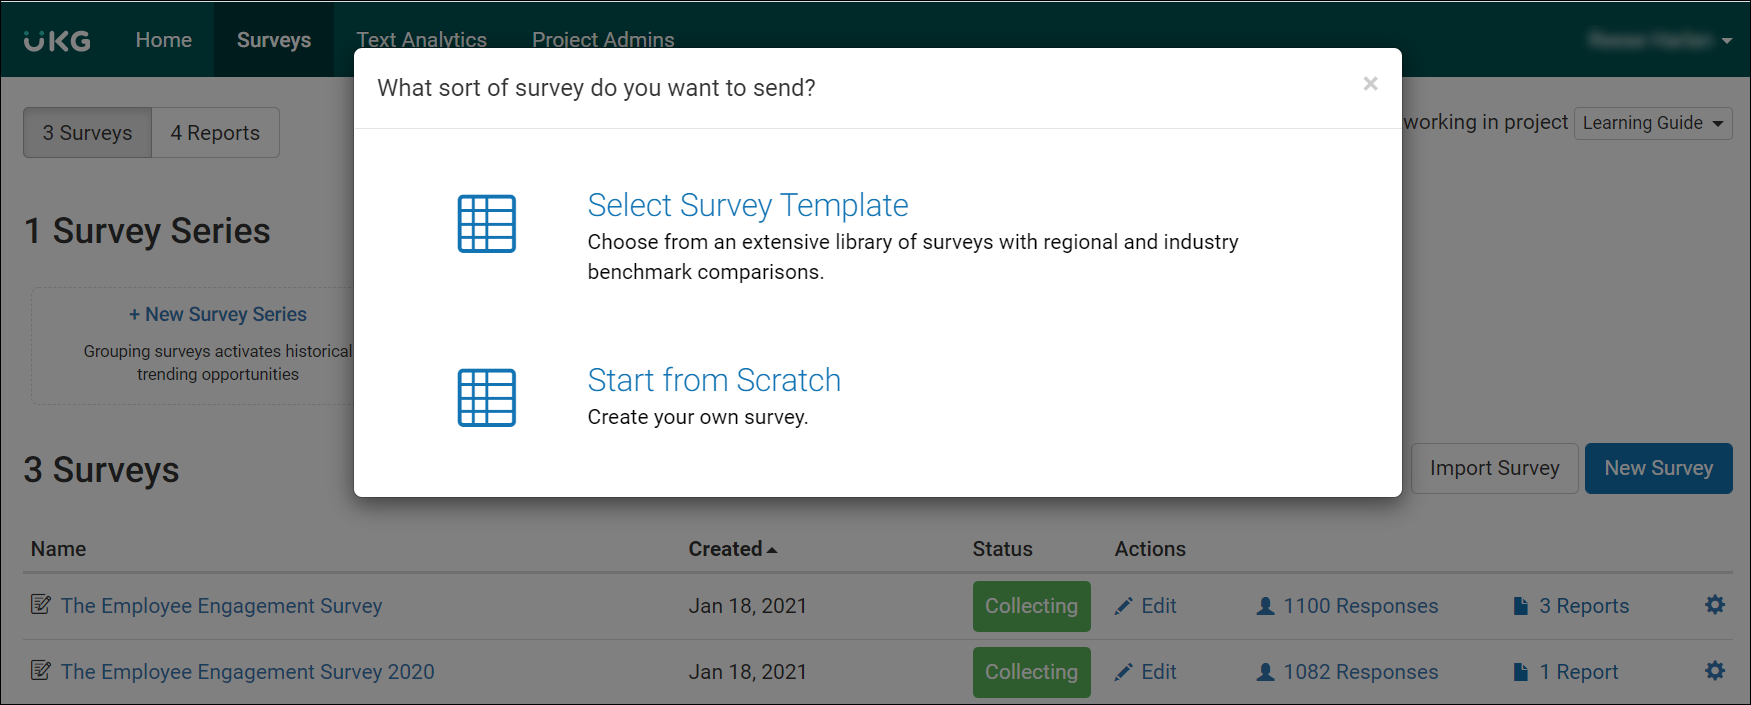
From the What Sort of Survey Do You Want to Send window, select on of the following
options:
- Select Survey Template
If you choose to create the survey using a template, continue to the Select Survey Template section of this document.
- Start from Scratch
If you choose to create the survey from scratch, skip to the Configure Survey Design section of this document.
- Select Survey Template
Select Survey Template
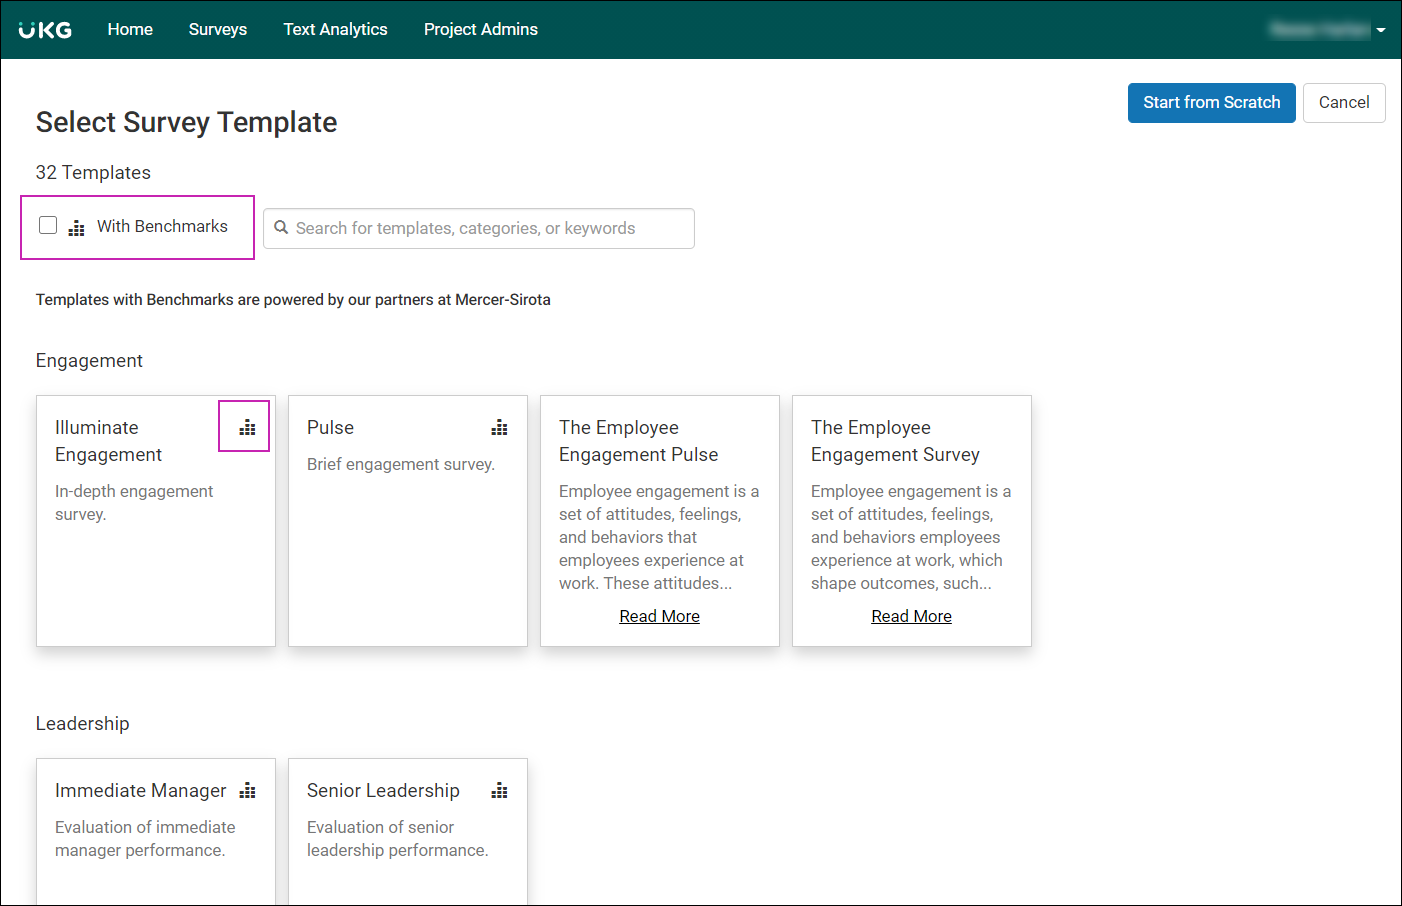
If you chose to create a survey using a template on the What Sort of Survey Do You Want to Send window, your next step is to select which template to use.
Templates created by UKG I-O psychologists are indicated with a Read More link.
Templates created by Mercer | Sirota are indicated with Bar Graph icon.
- Select the icon to view the industry and region benchmarks available on the template. Not all benchmarks are available on every template.
- Check the With Benchmarks box to view only templates created by Mercer |
Sirota.
 Note For help deciding which template to use, refer to the Employee Voice: Survey Templates Toolkit in the Learning Center.
Configure Survey Design
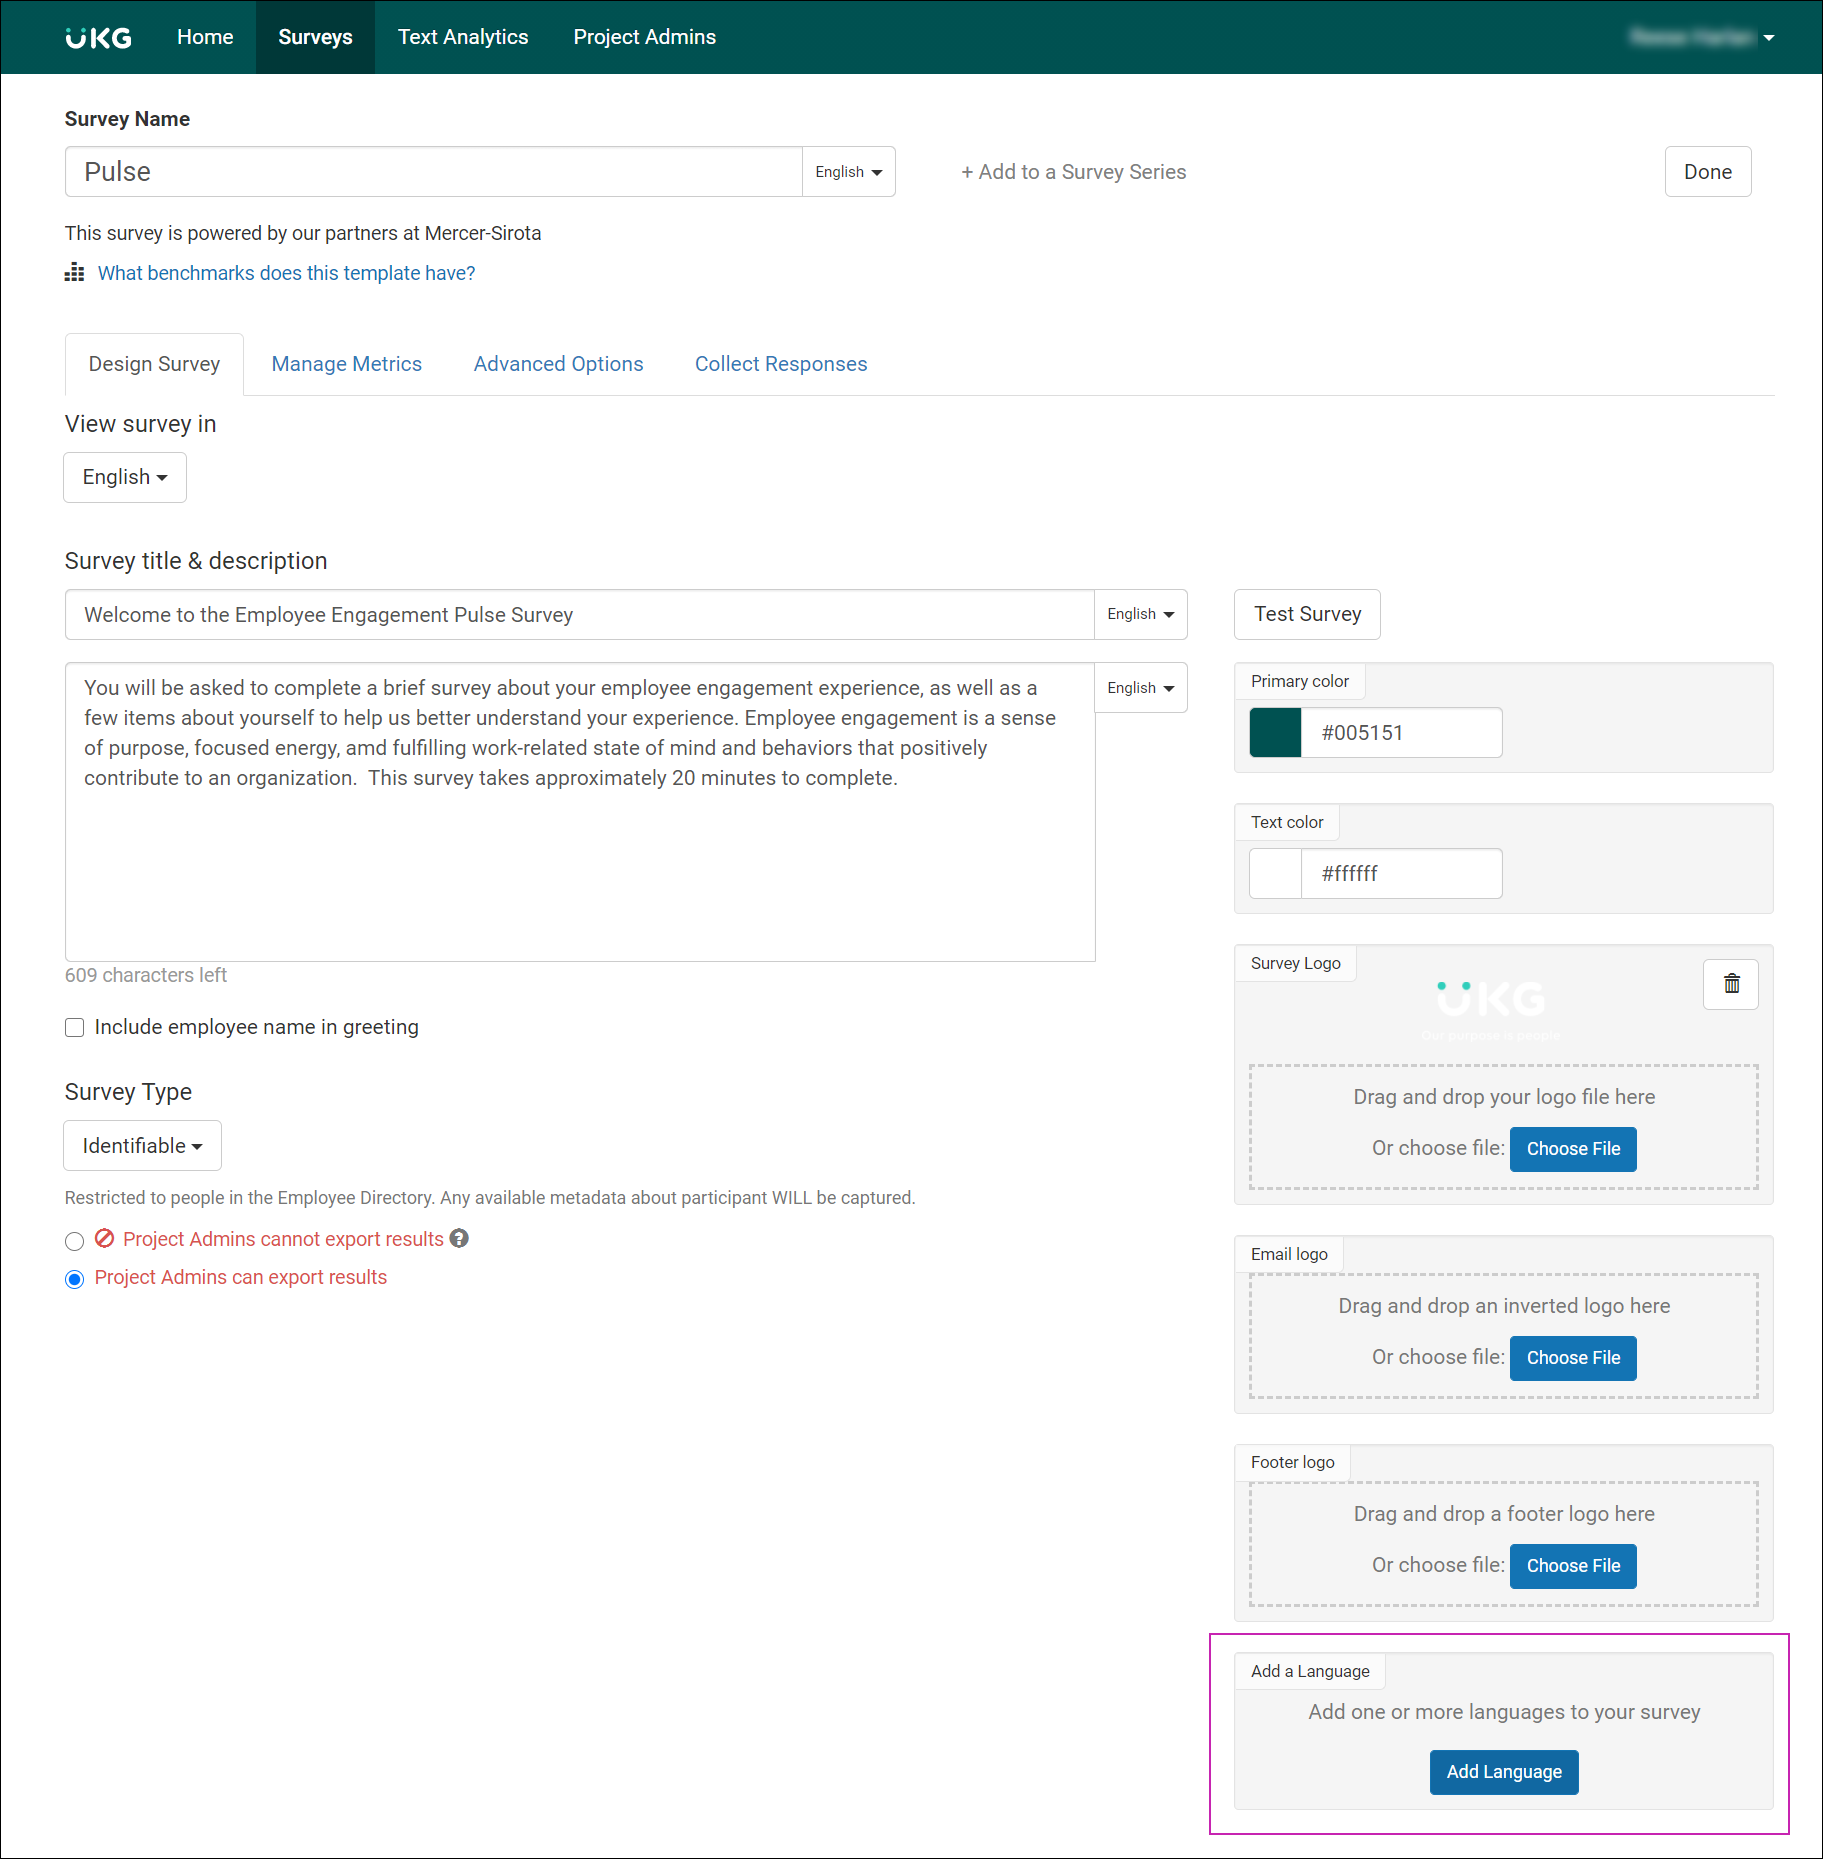
The survey design, such as title, description, colors, logos, privacy settings, export options, and goodbye message, are configured on the Design Survey tab.
- From the Design Survey tab, at the Survey Title & Description textboxes, enter the title and description that displays to respondents.
- Check the Include employee Name in Greeting box to include the respodents name in the greeting.
-
From the Survey Type drop-down list, select a privacy setting:
- Identifiable – associates employee metadata with survey responses. Metadata enables more robust filtering capabilities on reports and allows managers across the organization to see their team’s data. However, associating metadata with a response could make it possible to see who submitted the response.
- Anonymous – does not associate employee metadata with survey responses. Because no
metadata is associated with survey responses, there are restrictions around reporting
capabilities, such as the ability to filter by job title or location. However, since
no metadata is associated with a survey response, it is not possible to see who
submitted the response.Note Once a survey is launched, the privacy setting cannot be changed.
-
Select one of the following options:
- Project Admins Cannot Export Results – Project Administrators cannot export survey results into a Microsoft Excel document.
- Project Admins Can Export Results – Project Administrators can export survey results
into a Microsoft Excel document.Note Account Administrators can export all survey results into an Excel document at any time.
- Select Test Survey to preview the survey.
- At the Primary Color textbox, select a color or enter the Hex color code.
- At the Text Color textbox, select a color or enter the Hex color code.
- At the Survey Logo box, drag-and-drop your logo file or select Choose File. The recommended image size is 400 x 300 pixels.
- At the e-mail Logo box, drag-and-drop an inverted logo or select Choose File. The recommended image size is 300 x 50 pixels.
- At the Footer logo box, drag-and-drop a footer logo or select Choose File. The recommended image size is 300 x 50 pixels.
-
In the Goodbye Messages section:
- At the Survey Headline textbox, enter a personalized message to the survey taker.
- At the Survey Sub Text textbox, enter additional text, if needed.
-
Check the Allow Recipients to Opt In To HR Communications box, if needed.Note If respondents check the Allow Recipients to Opt In To HR box, their email address is provided with their survey responses, and they give up their right to confidentiality.
- Select Done to save the survey.
Configure Questions
When configuring survey questions, there are a few things to consider:
- Will you create your own questions or use questions from the question library?
- How will you organize the questions using question pages?
- Will you use display logic to display specific questions to a targeted audience?
- Will you use branching logic to display specific questions to a respondent based on their answer choice?
- Make note of the question.
- Delete the question.
- Create a new question with the original text and make changes as needed.
- Add Question Pages
- Add Custom Questions
- Add Questions from Question Library
- Configure Display Logic
- Configure Branching Logic
Add Question Pages
Question pages enable you to display survey questions on multiple screens. For example, the first page of the survey includes a welcome message, the second page includes engagement questions, the third page includes diversity questions, and the last page includes the goodbye message.
- Group questions by topic
- Branch to different question pages depending on the respondent's answer to a question using branching logic.
- Display question pages to a specific audience using display logic.
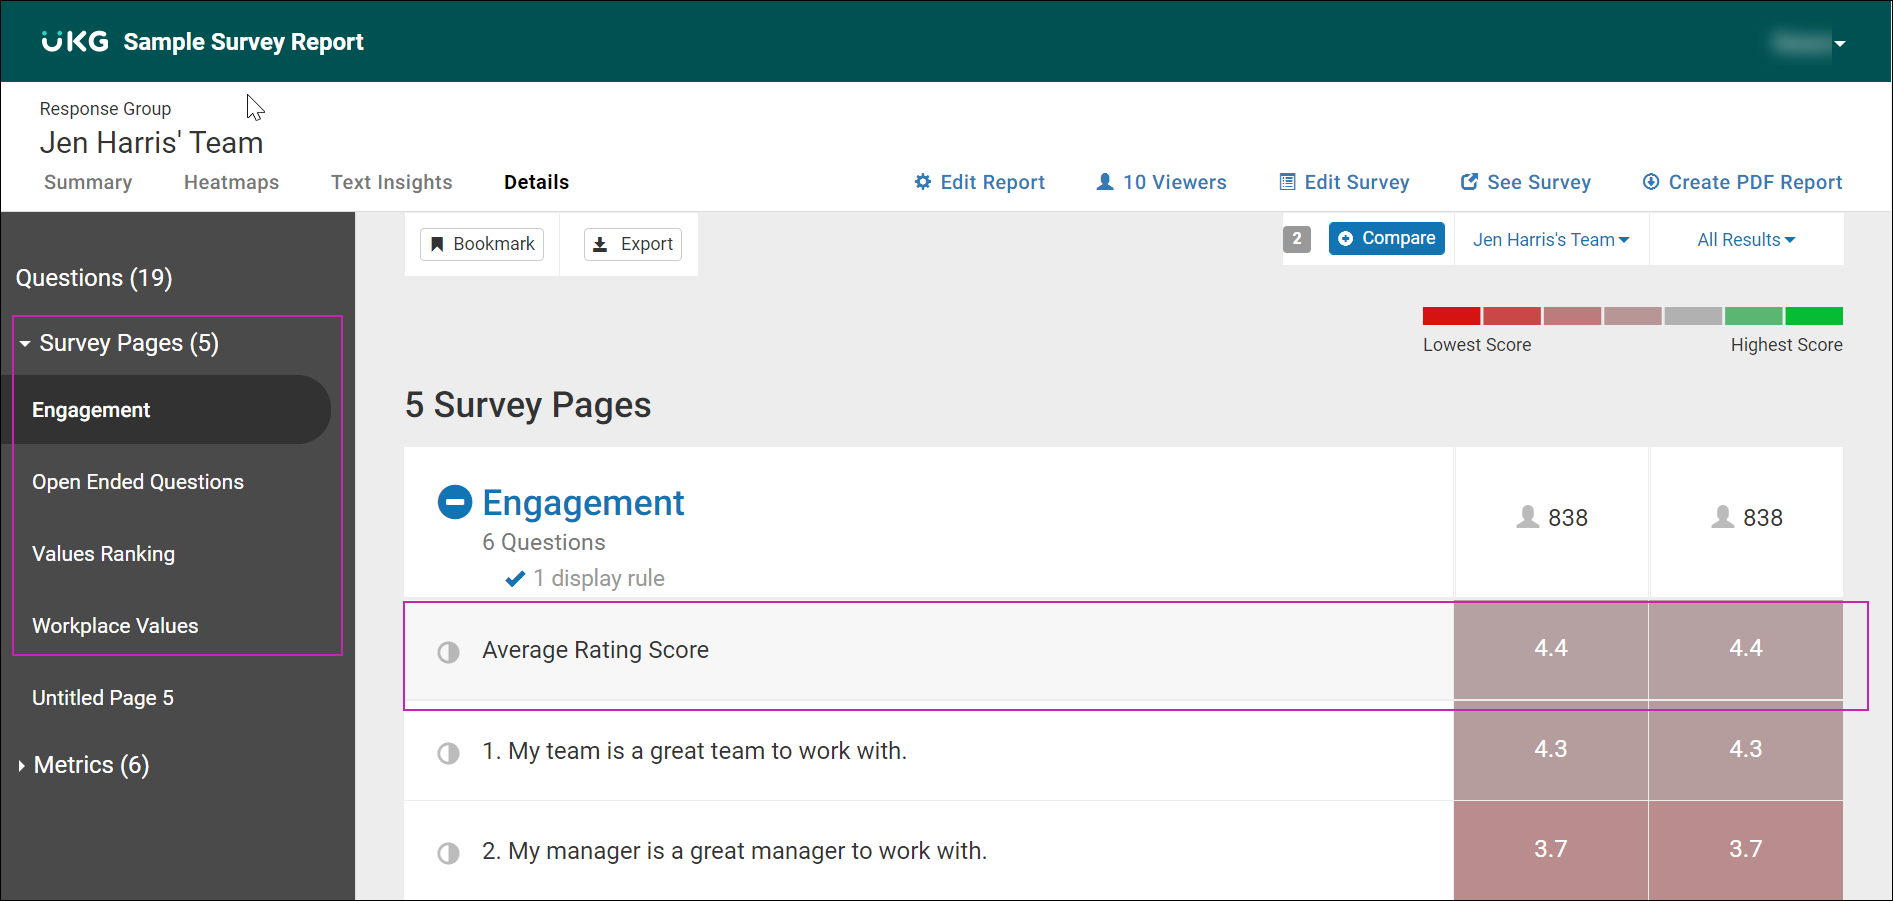
Question pages also provide another way to view data on reports. For example, on the Details page of Manager Results and Custom reports, you can view the questions on each question page and receive an average score for each question page.
-
Select the Gear icon and select Preview to preview the question page.
 Note Question pages can be reordered by dragging the question page block up or down.
Add Custom Questions
Employee Voice allows you to create your own questions to meet your business needs. The following question types are available:
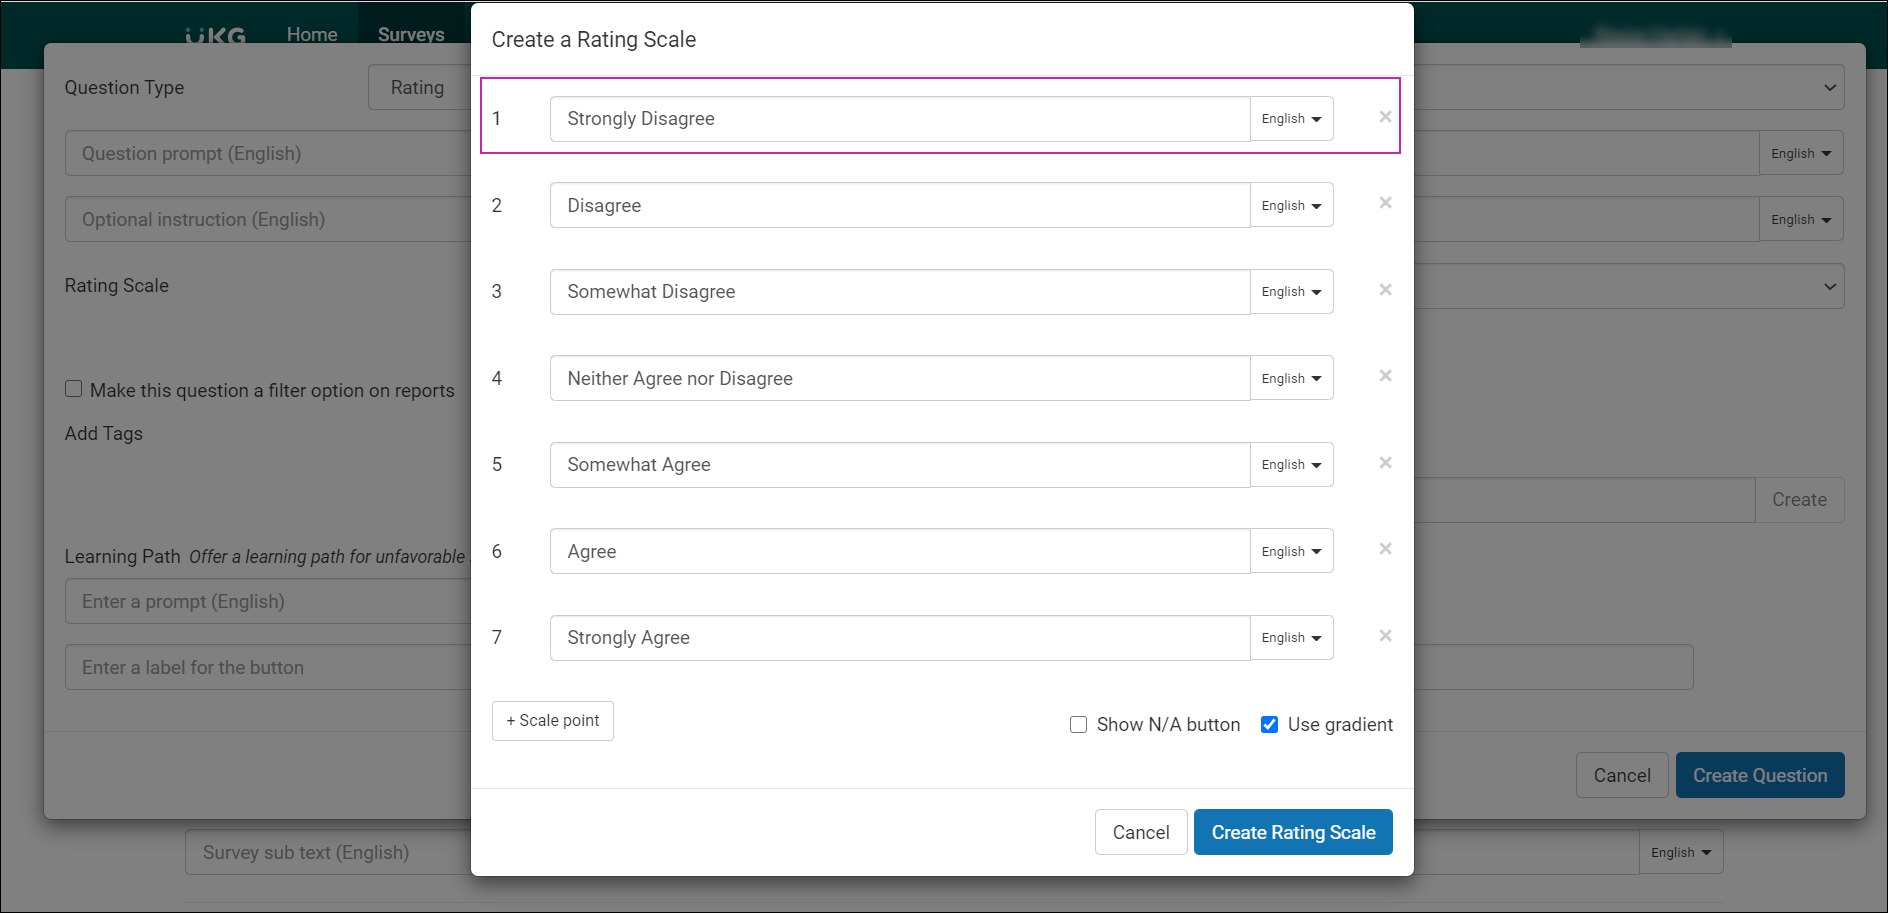
- Rating
- Rating NPS
- Ranked Choice
- Multiple Choice Ranking Follow-Up
- Multiple Choice Drop-Down
- Multiple Choice Check Box
- Open-Ended
Add Questions from Question Library
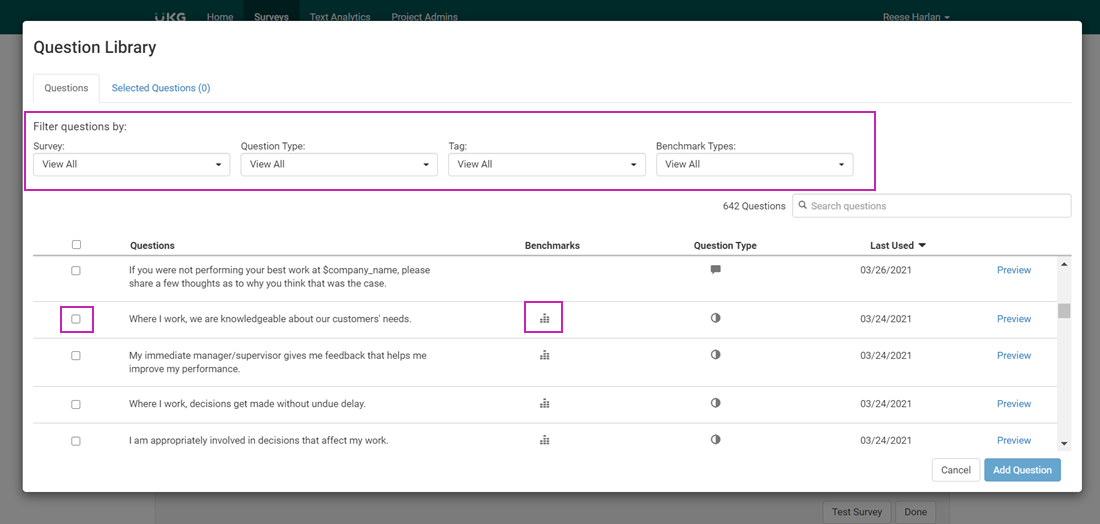
The question library includes:
-
Check the box next to one or more questions and select Add Question(s).
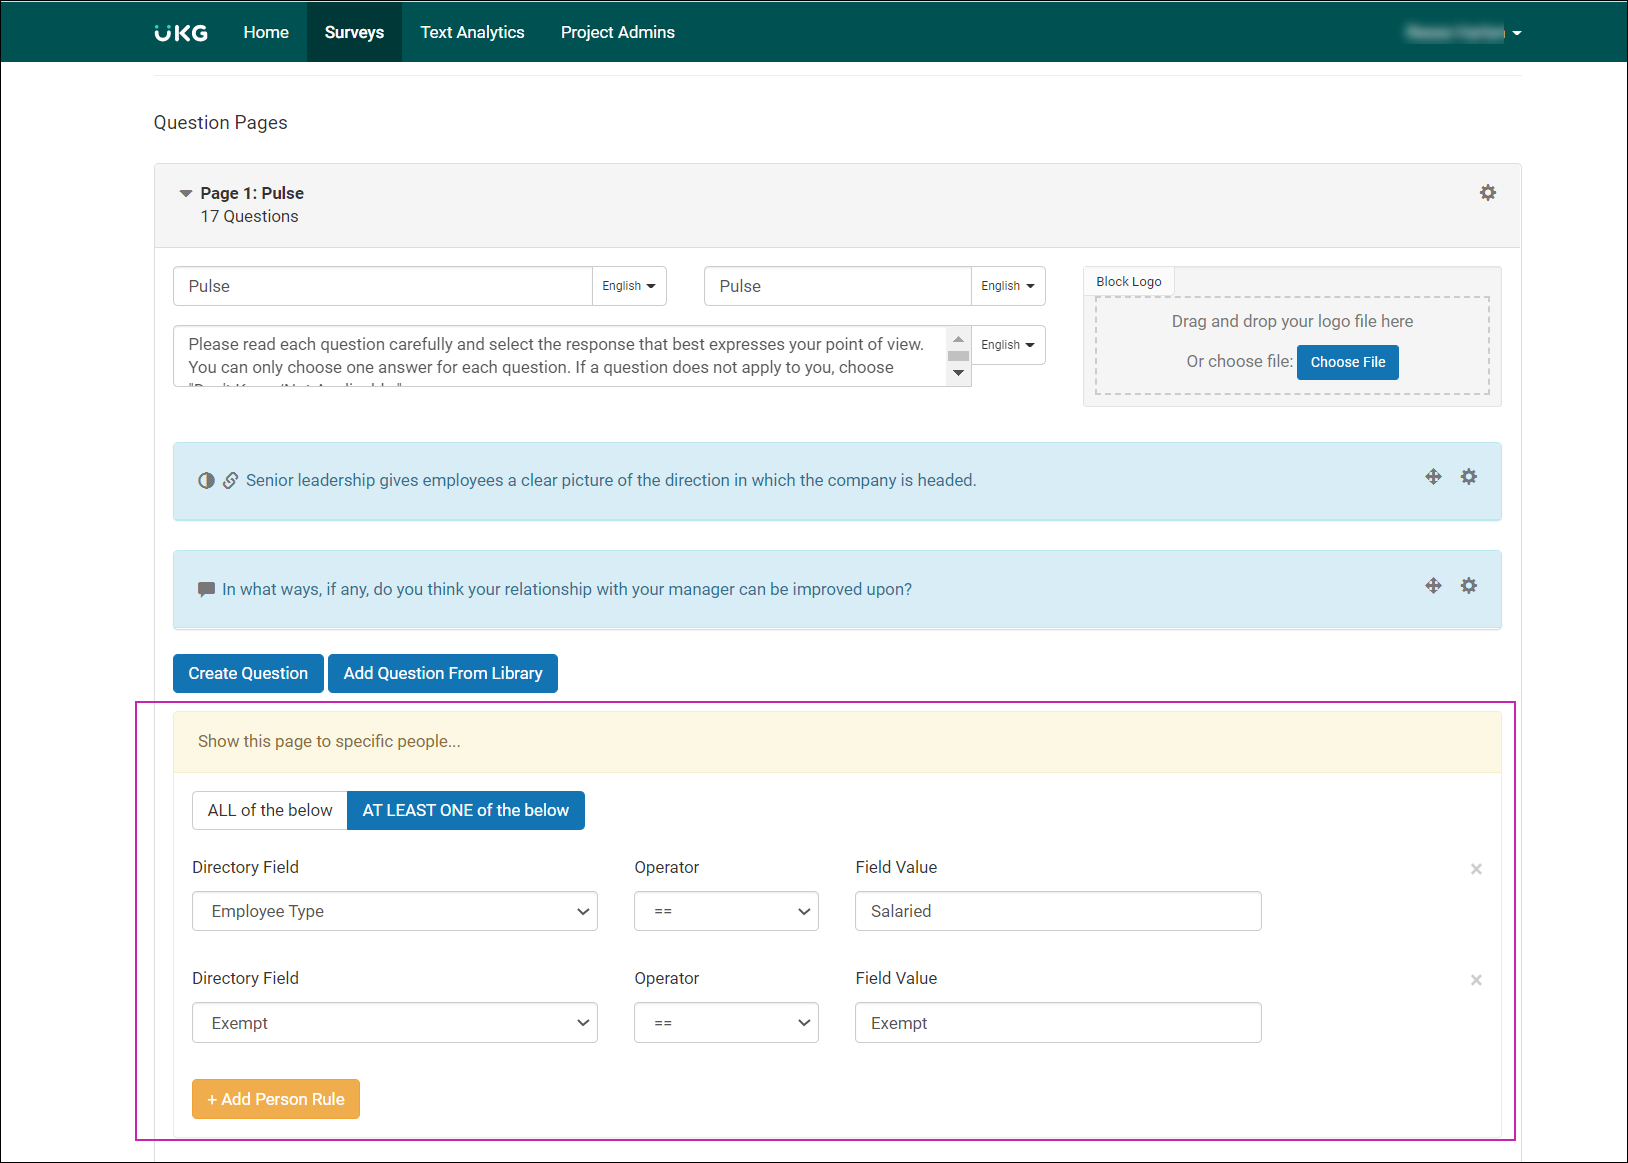
Configure Display Logic
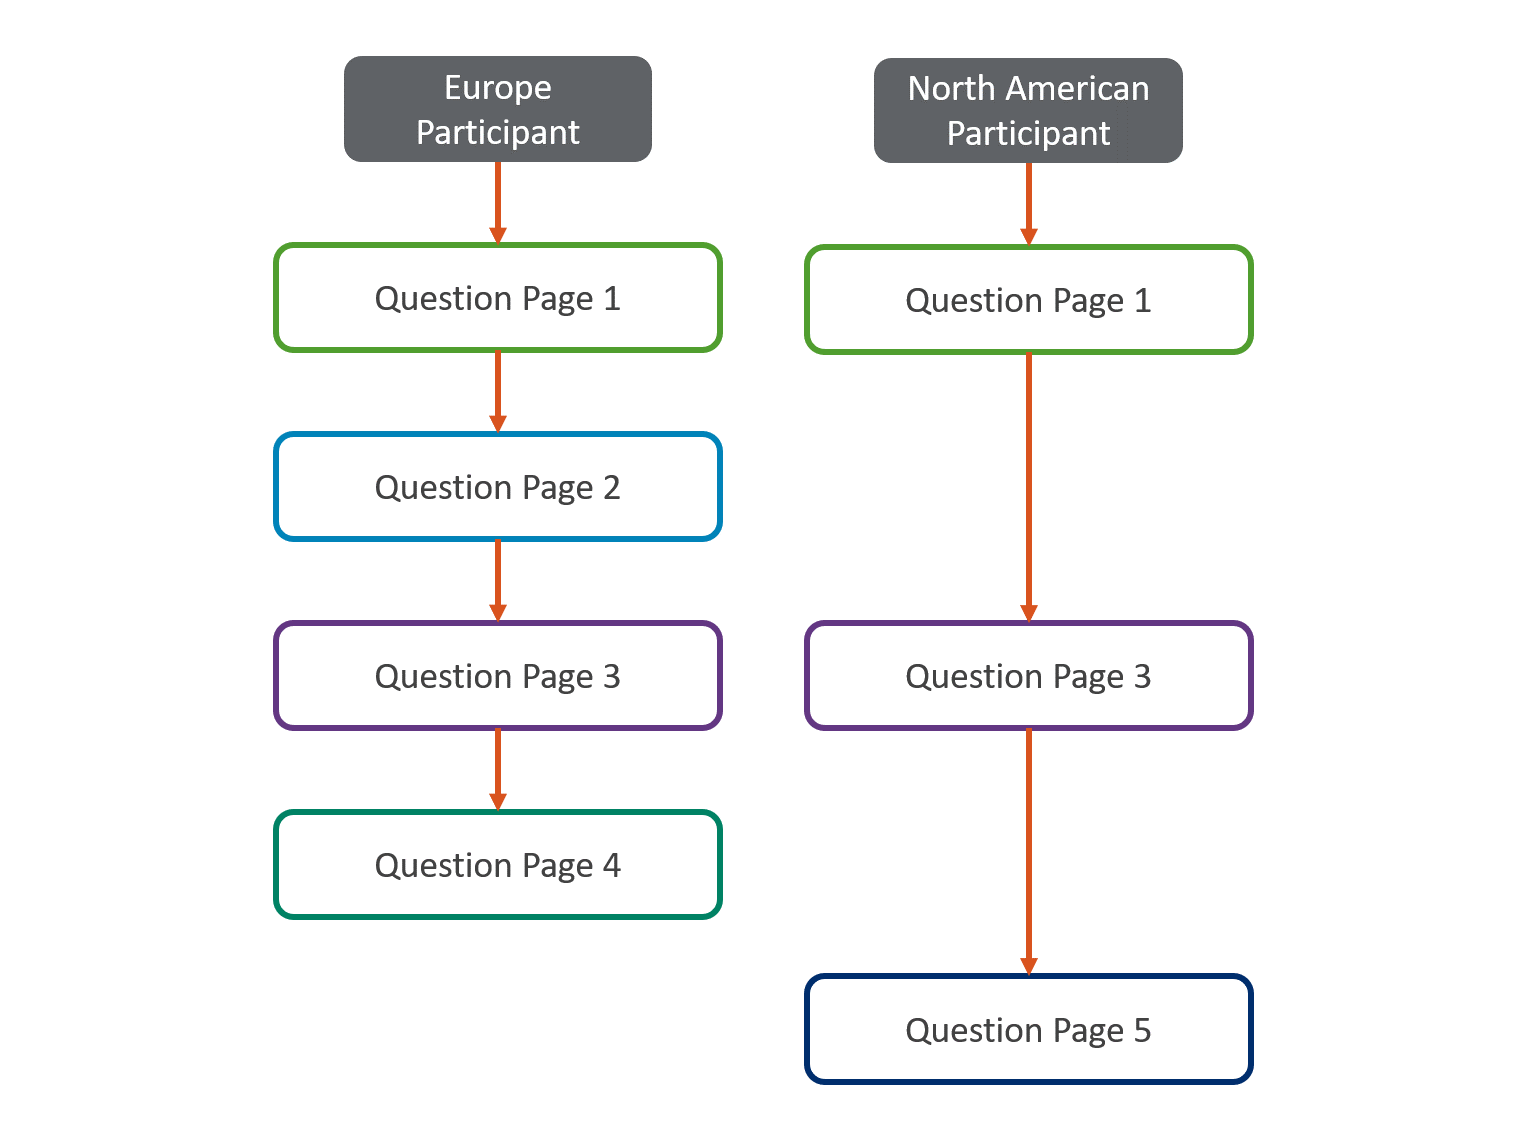
Display logic enables you to display specific questions to a targeted audience. For example, you may have questions that only employees in Europe should answer and other questions that only employees in North America should answer.
-
Configure additional rules, as needed.
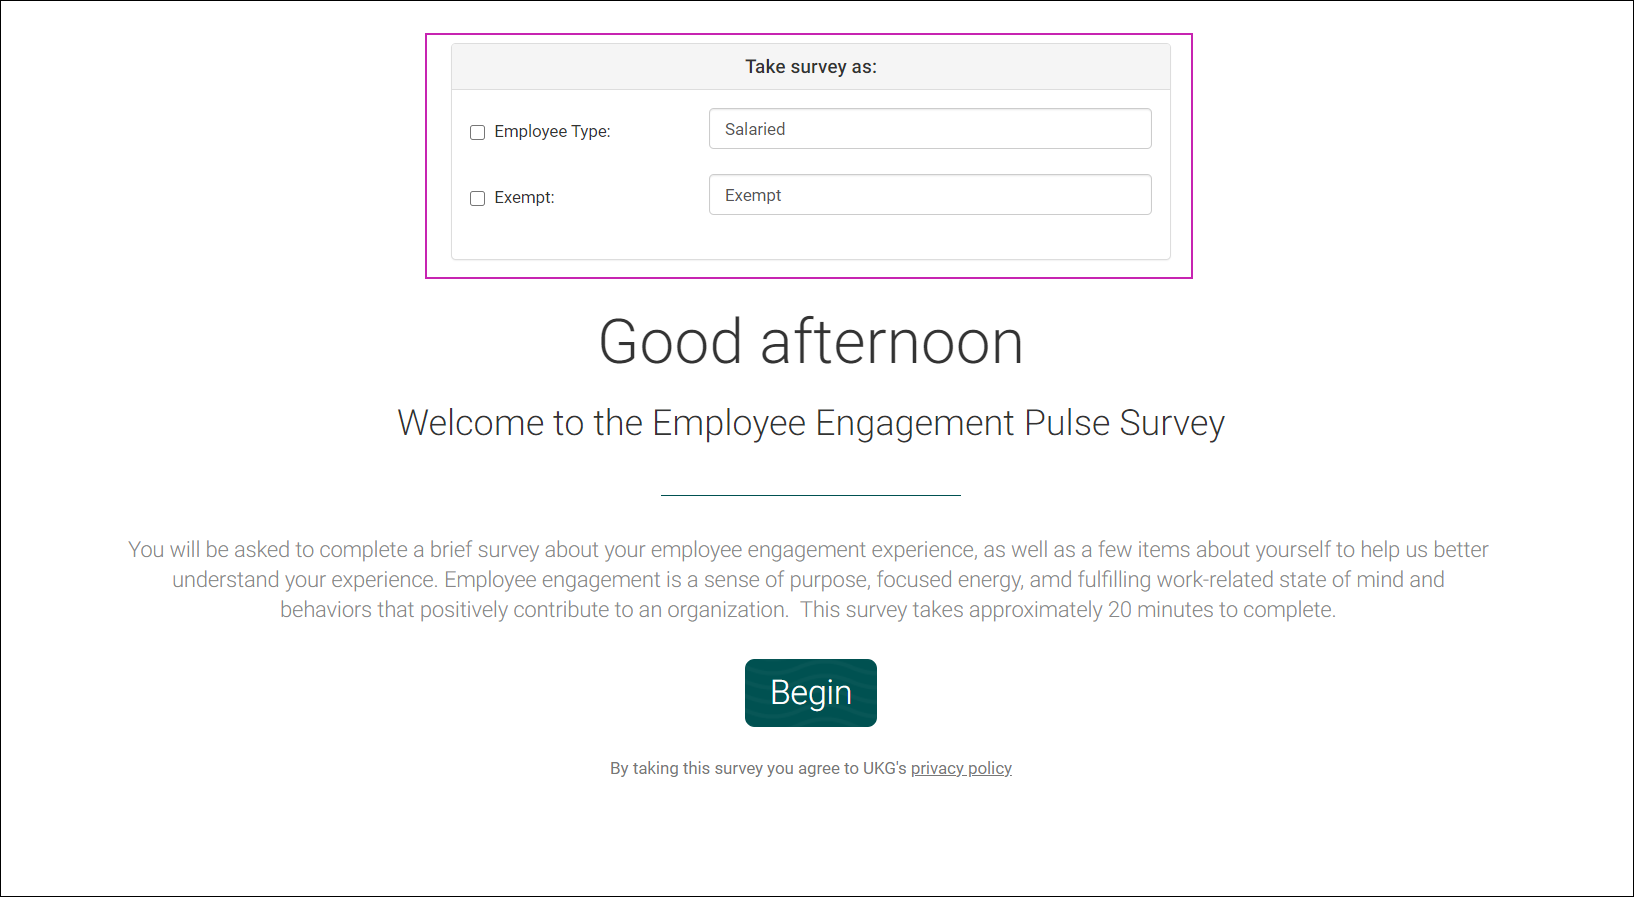
Test Display Logic
We recommend testing the display logic to make sure it behaves as intended.
-
In the Take Survey As box, select a check box and enter a value in the text box. For
example, to view the survey as a female employee, check the Gender box and enter Female in
the text box.
Configure Branching Logic
Branching logic enables you to display specific questions to a respondent by linking their answer choice to a rating, ranking, multiple-choice, or open-ended question to a specific question page.
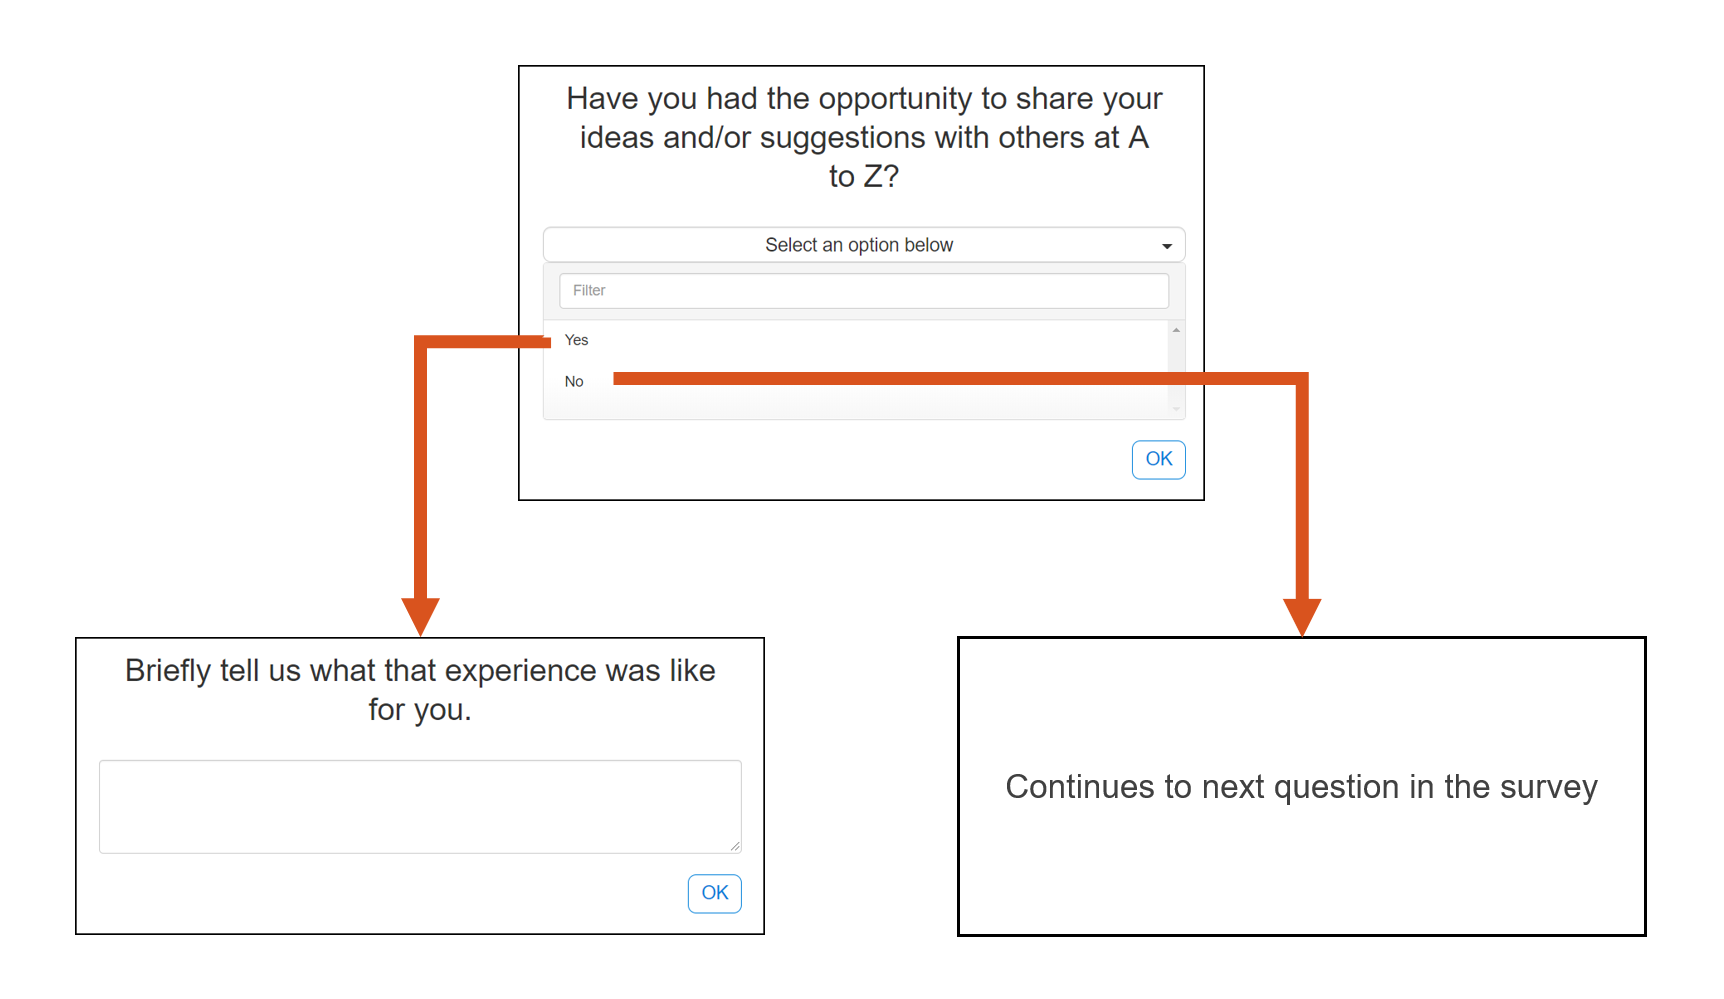
-
From the Page drop-down list, select the page for branching.
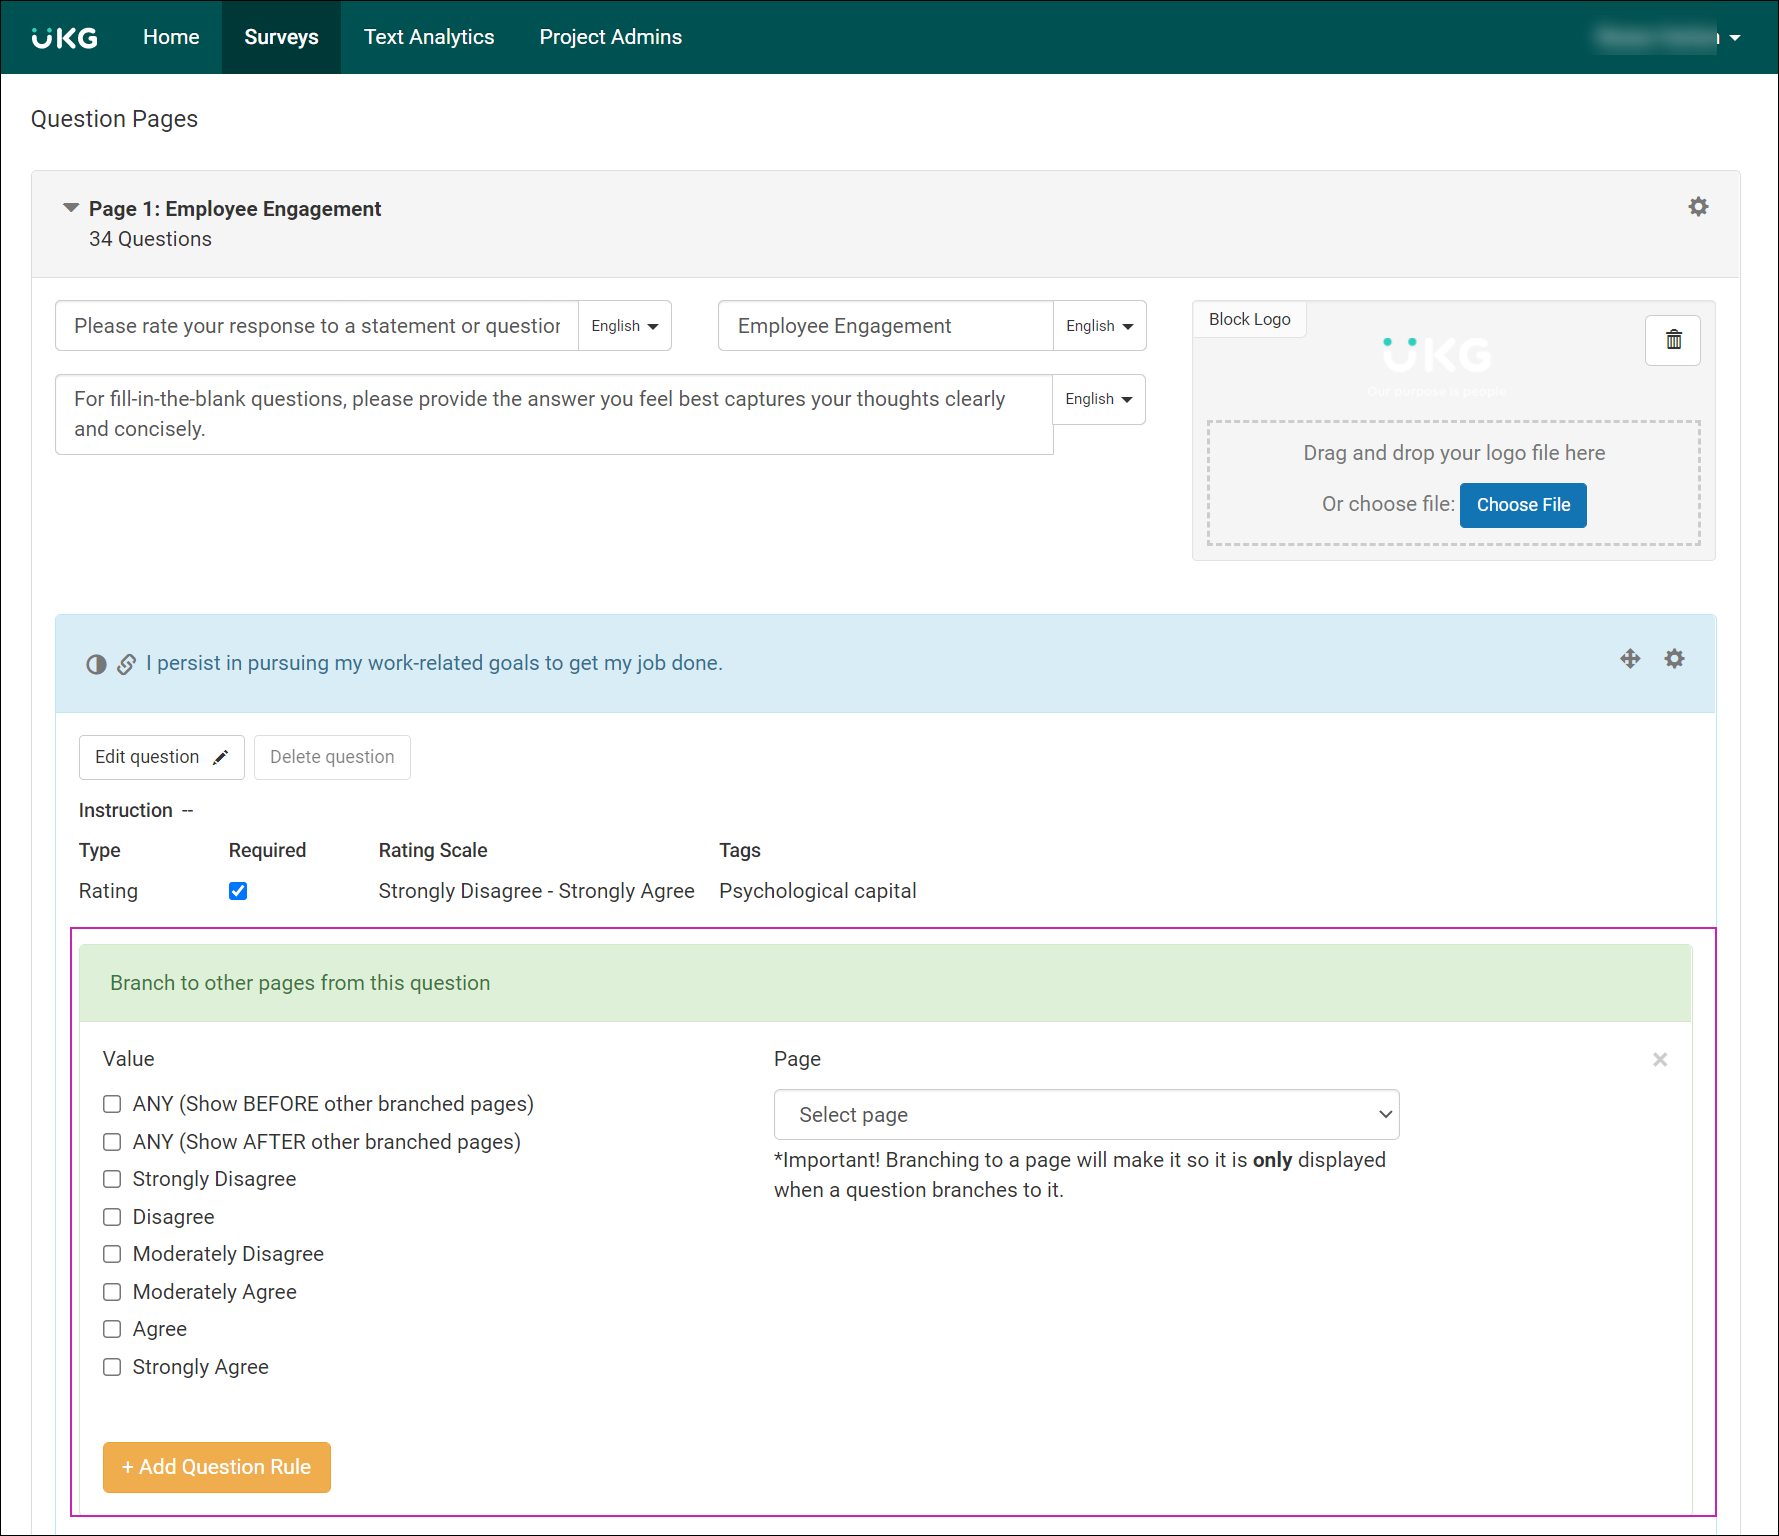 Note The pages listed in the Page drop-down list come from the Page Title field.
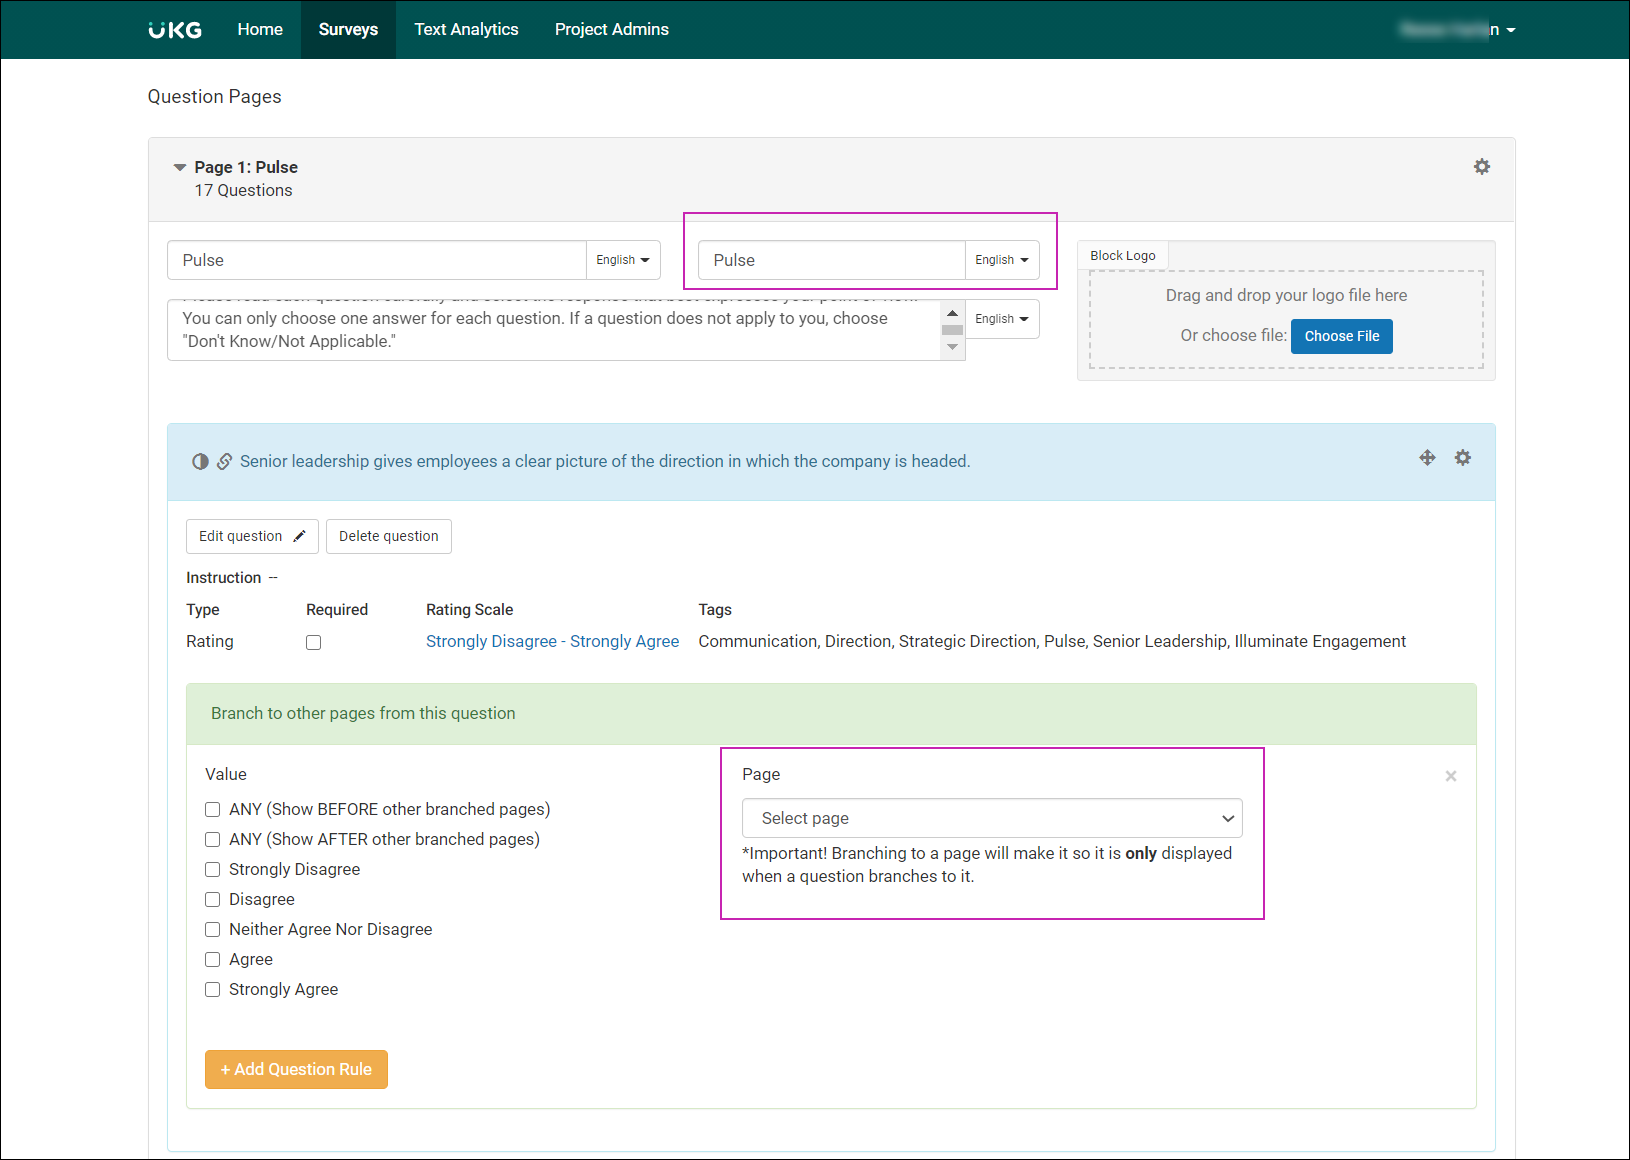
Configure Metrics
Metrics are a quantifiable measure that is used to track and assess things that are important to an organization, such as engagement, diversity, innovation, and agility.
- Additional ranking questions
- One or more open-ended questions
- One or more themes
Create a Metric
One or more metrics can be added to a survey.
- From the Manage Metrics tab, at the Create a New Metric text box, enter the name of the metric.
- Select the Plus icon.
- From the Add and Remove Rating Questions window, select one or more rating questions.
- Select Done.
-
In the Metric Description section, at the Metric Description textbox, enter a
description for the metric.Note Descriptions for Employee Voice metrics are pre-populated, but can be edited.
- In the Link Rating Questions section, at the Normalize the Rating Scale text boxes, enter values to normalize the rating scale.
- Select Done.
Add Additional Rating Questions
At least one rating question must be added to a metric, but you have the option to add additional rating questions.
-
Select Done.
Add Ranking Questions
You have the option to add ranking questions to a metric.
-
Select Done.
Add Open-Ended Questions
You have the option to associate open-ended questions to a metric.
-
Select Done.
Map a Theme to a Metric
You have the option to add a theme to a metric.
-
Select Done.
Note To activate the option to toggle between Associate Open-Ended Questions and Map Themes to This Metric, select a radio button from the Associate Unstructured Results section.
Configure Tags
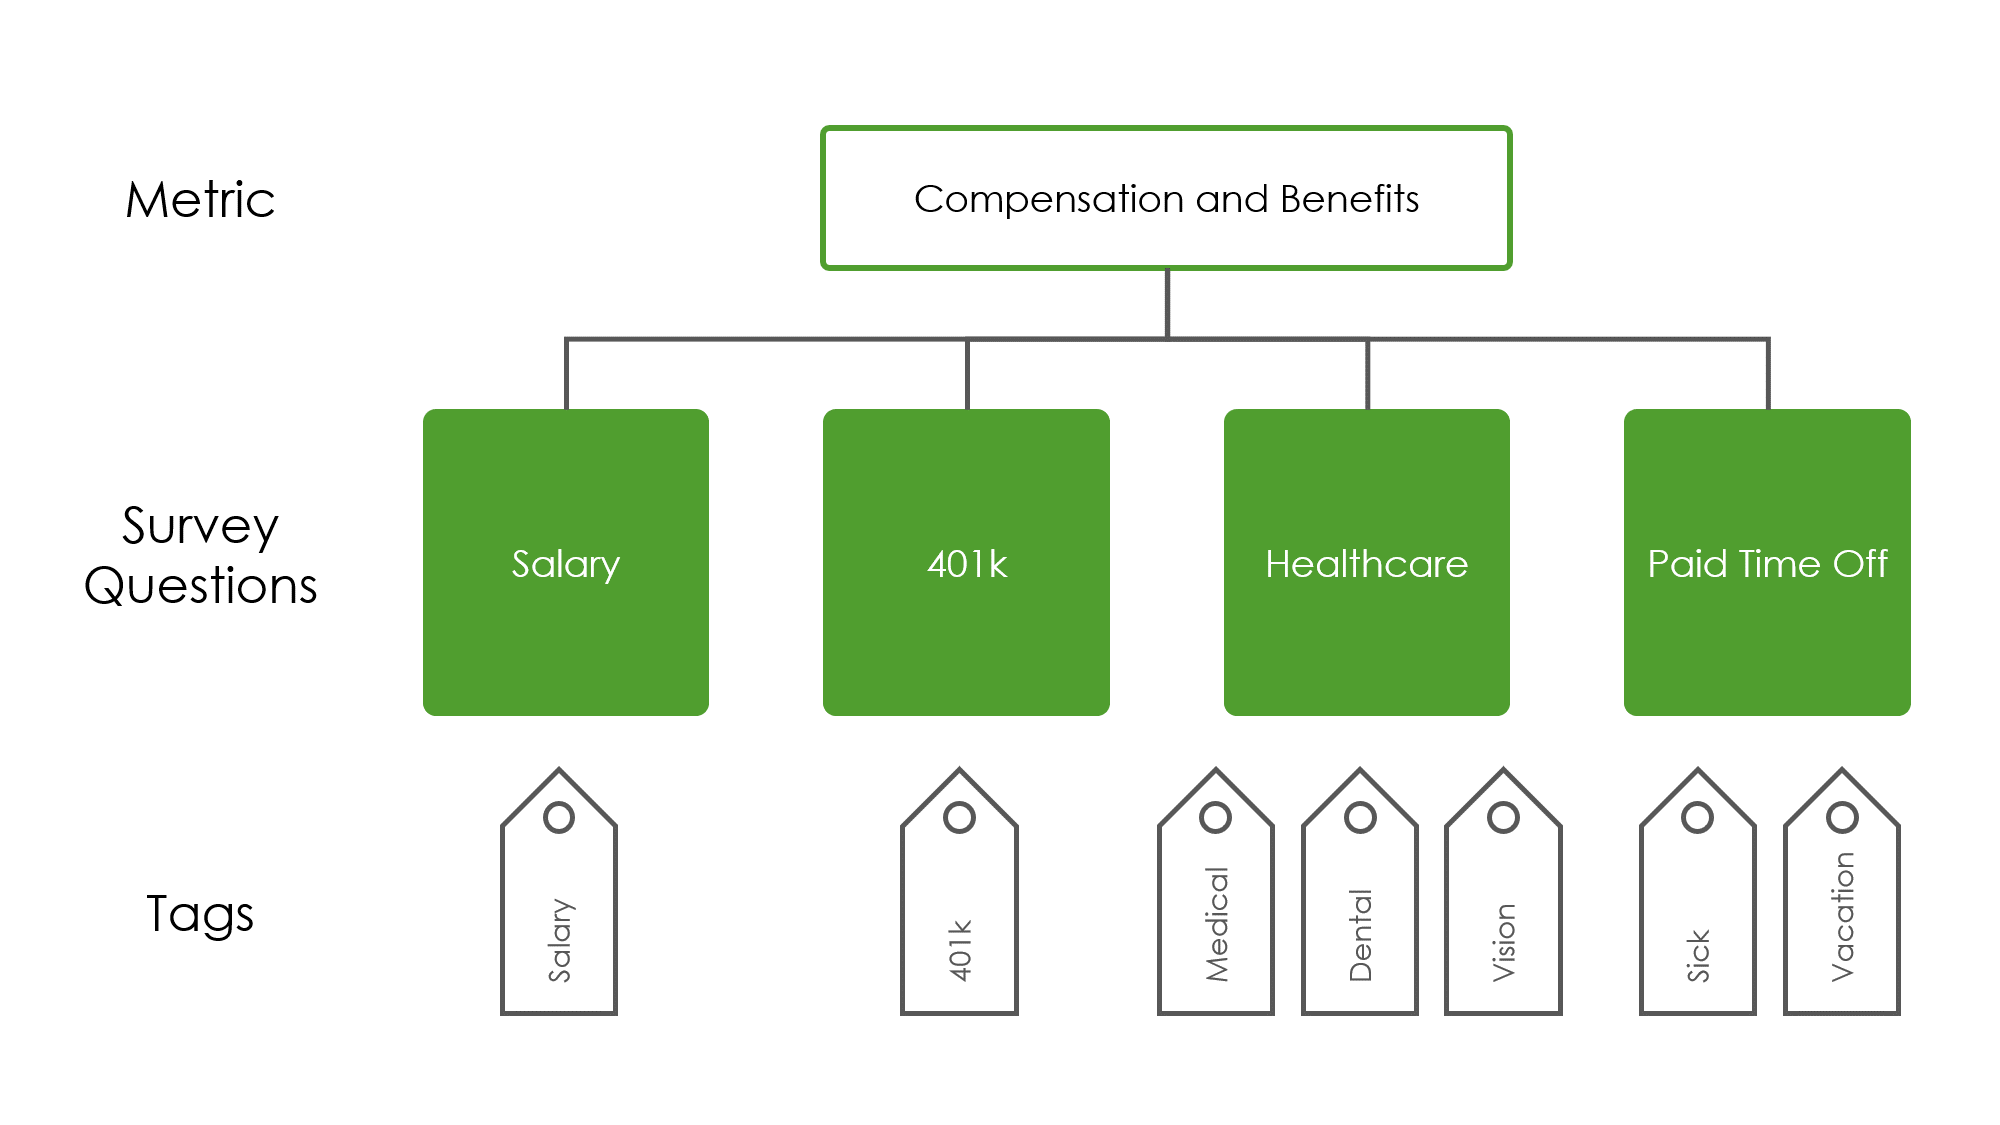
Tags are labels assigned to questions and provide another way of analyzing survey responses.
One way to use tags is to define sub-themes within a metric. For example, a survey may have questions about salary, 401k, healthcare and paid time off. All of these questions are assigned to the Compensation and Benefits metric. A Salary tag can be assigned to the questions about salary. Medical, Dental, and Vision tags can be assigned to the questions about healthcare. A 401k tag can be assigned to the questions about 401k. A Paid Time Off tag can be assigned to the questions about paid time off.
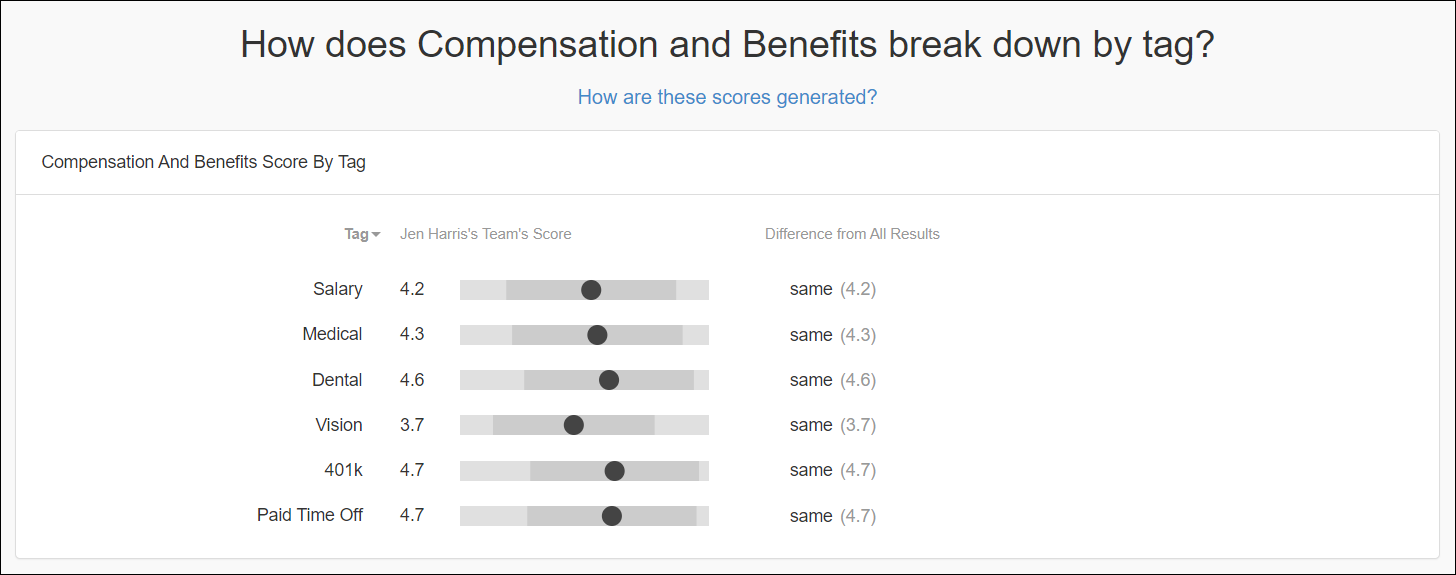
Tags enable you to view survey results sorted by tag on the Details page of reports.
The following image shows the Compensation and Benefits Metric Details page of a report. Compensation and Benefits is the metric, and Salary, Medical, Dental, Vision, 401k, and Paid Time Off are the tags.
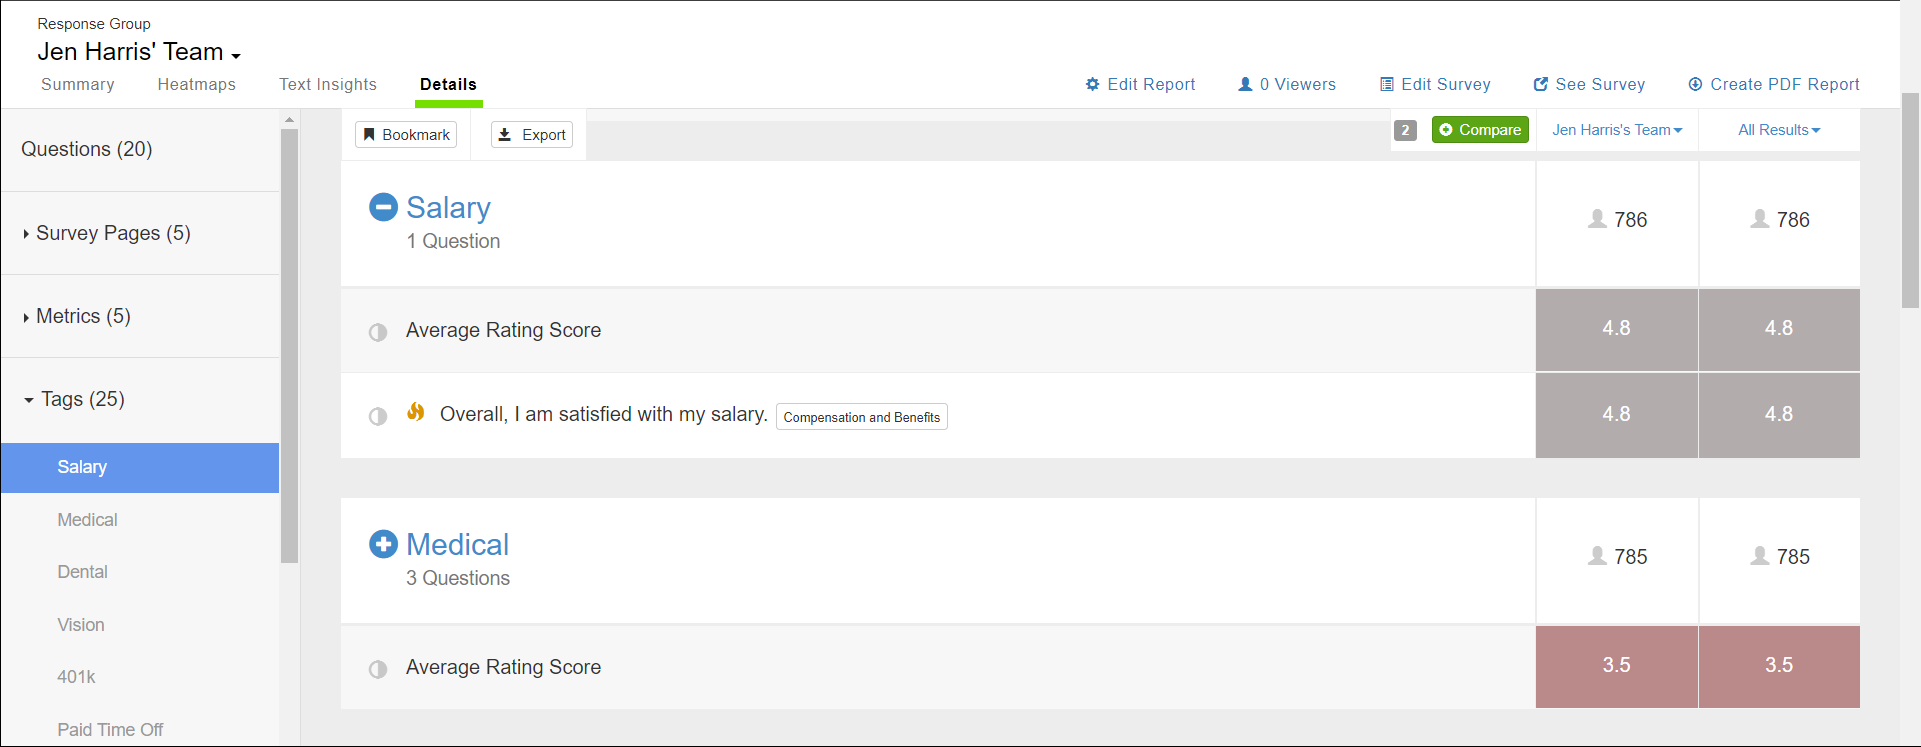
The following image shows the Details page of a report. By selecting Tags from the left menu, you can see the Average Favorability (or Rating Score) and Average EPS for all questions associated with the tag.
Add Tags
Tags must be added to a survey before launching the survey or they will not able available on reports.
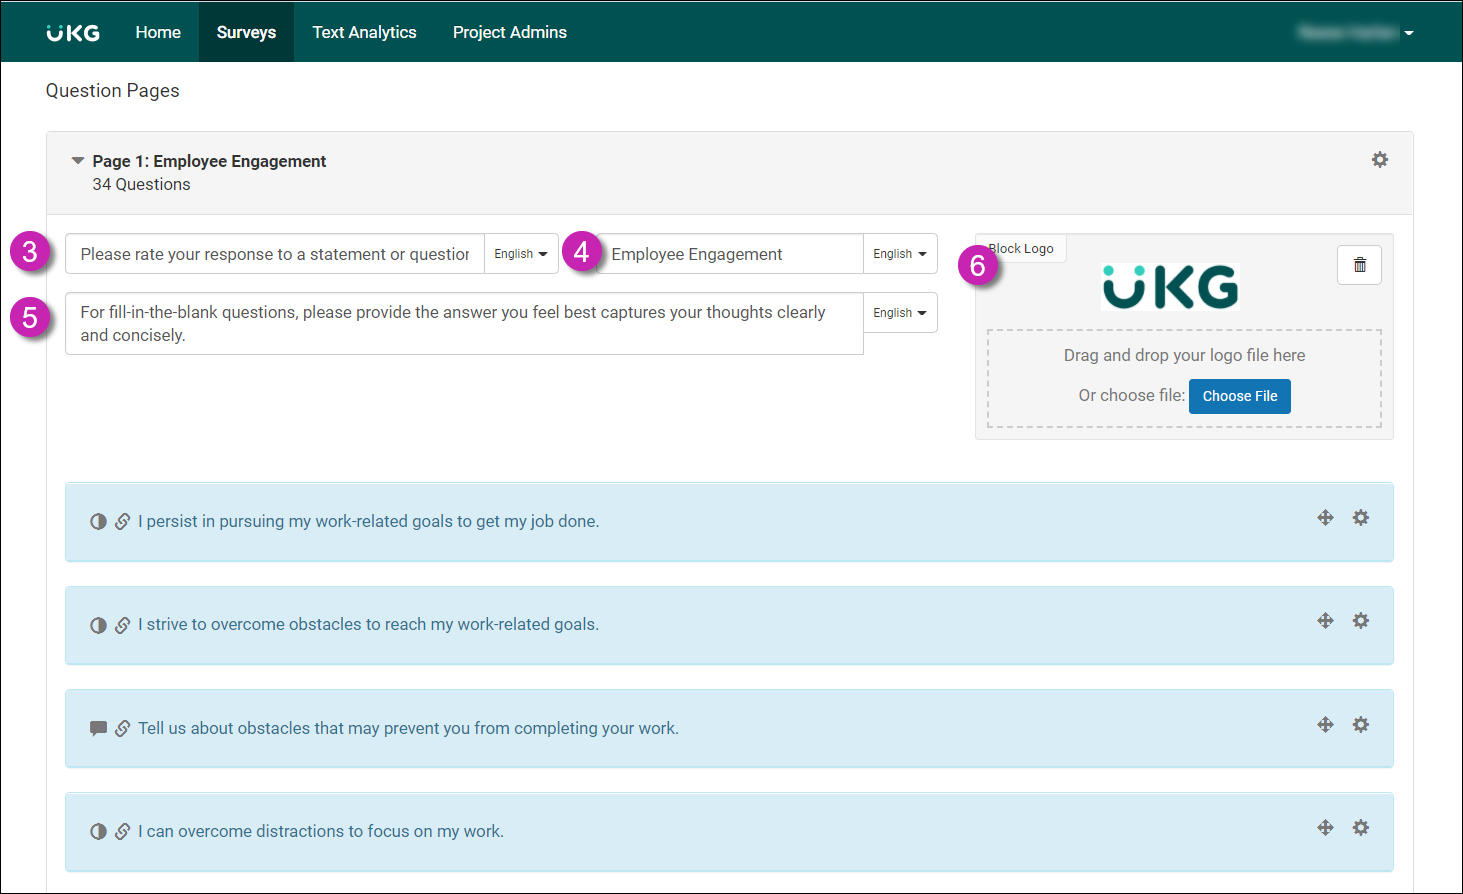
- From the Design Survey tab, in the Question Pages section, select a page number.
- Select a question.
- Select Edit Question.
- In the Add Tags section, select one or more tags, or enter a new tag in the Create New Tag Field.
-
Select Save Question.Note Tags cannot be deleted. When a tag is created, it is available at the project level.
Configure Benchmarks
Benchmarks allow you to compare different data sets to your base data set when analyzing survey results.
- Internal Comparisons - enable you to compare segments of the population, such as a specific manager’s team, a collection stream, or an employee directory field. Internal comparisons are configured on the report.
- Imported Benchmarks – enable you to import benchmark data from outside of Employee Voice. Imported benchmarks are imported to the Advanced Options tab when creating a survey and are configured on the report.
- External Benchmarks – enable you to use benchmarks from a third-party, such as Mercer | Sirota. External benchmarks are configured on the report.
- From the Advanced Options tab, select Add a Benchmark.
- At the Title Your Benchmark text box, enter a title for the benchmark.
- Select Export This Survey’s Questions.
-
The downloaded CSV file includes all rating questions and NPS questions that are
configured on the survey. Enter benchmark data on the CSV file using the following
guidelines:
- Rating Average – should be a value between one and the number of points in the question’s rating scale.
- Percent Favorable – should be a value between zero and one. This field is only needed for rating questions.
- Standard Deviation – should be a value greater than or equal to zero. This field is only needed for rating questions.
- NPS Score – should a value between -100 and +100. This field is only needed for NPS rating questions.
- Drag and drop the CSV file to the box or select Choose File.
Configure Translations
Employee Voice surveys can easily be translated into over 100 languages using the Add a Language feature.
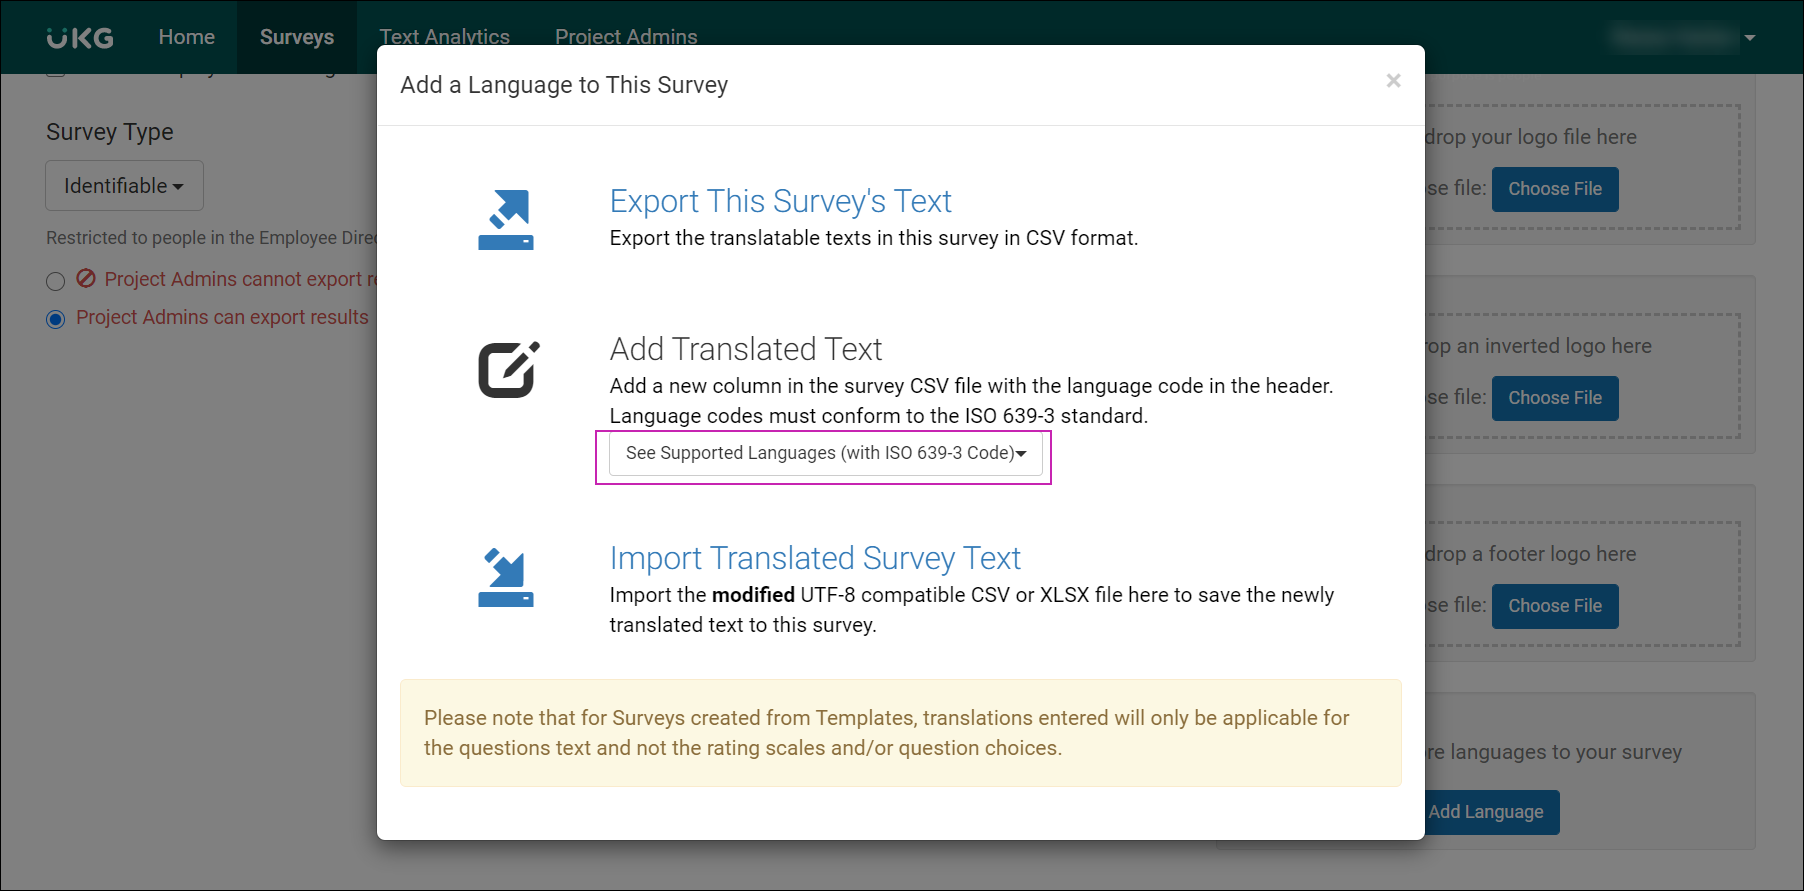
Import Translated Survey Text
To import translated survey text:
-
From the Design Survey tab, in the Add a Language box, select Add Language.
-
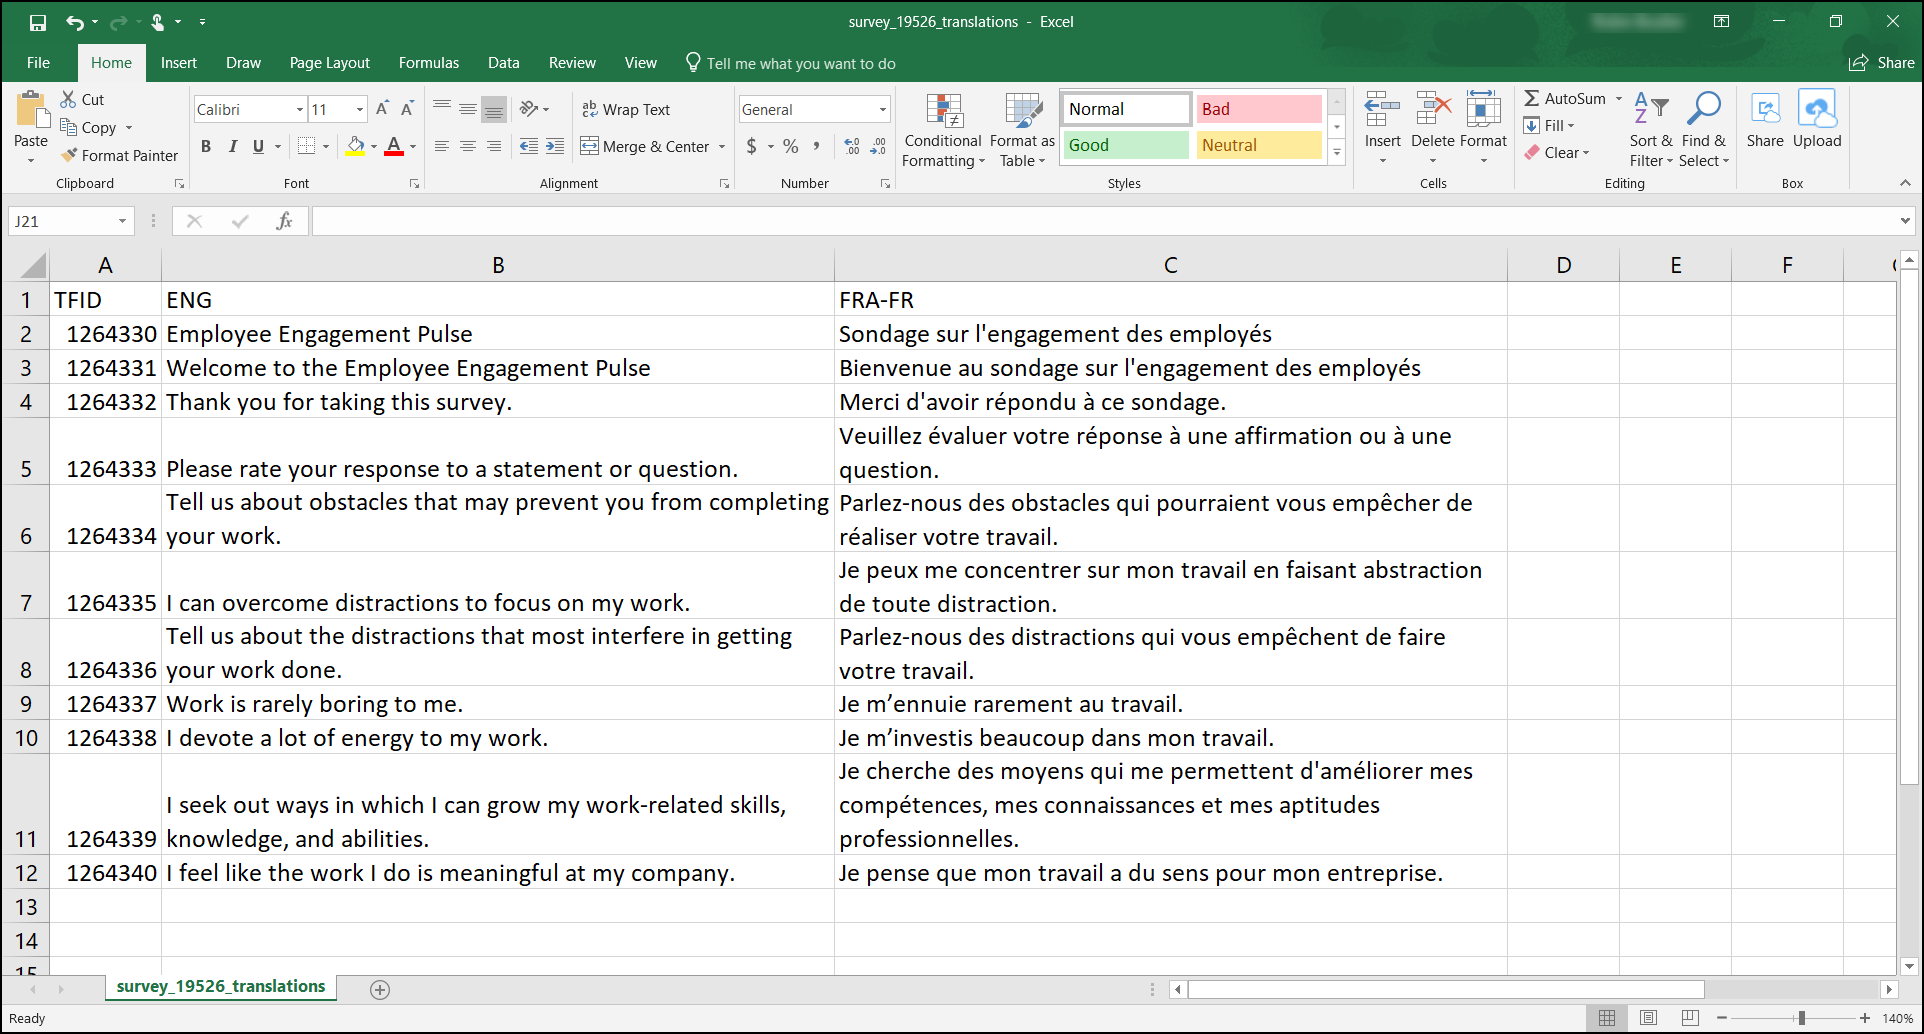
Open the downloaded CSV file and add a column for each language.
The column header must contain the ISO 639-3 standard language code, which can be found on the Add a Language to This Survey window or on the Employee Voice: Supported Language Codes Job Aid.
 For example, in the Excel spreadsheet:
- Column A displays the text ID number. Do not modify the text in this column.
- Column B displays the survey text in English. The column header displays the language code, ENG.
- Column C displays the survey text in French. The column header displays the
language code, FRA-FR.
-
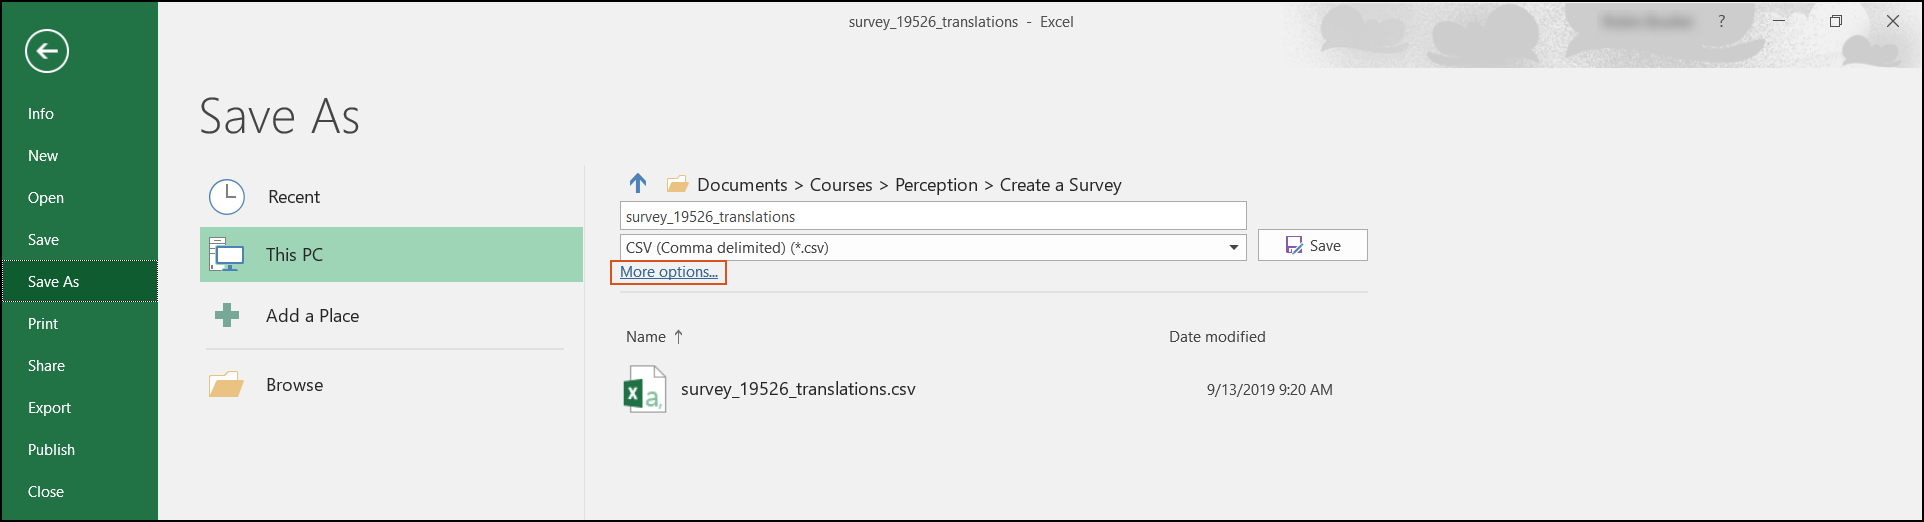
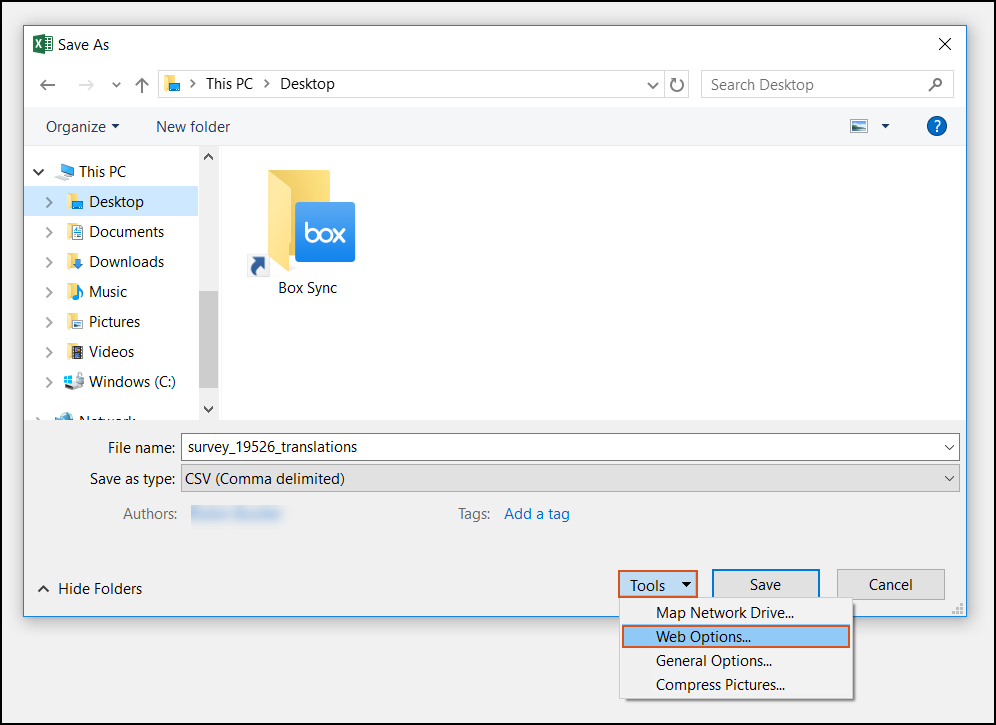
Once all translated text has been added to the CSV file, save the CSV file as
UTF-8.
From Excel:
-
Select More Options.
-
Select Tools, and then select Web Options.
-
Check the box, Always Save Web Pages in the Default Encoding.
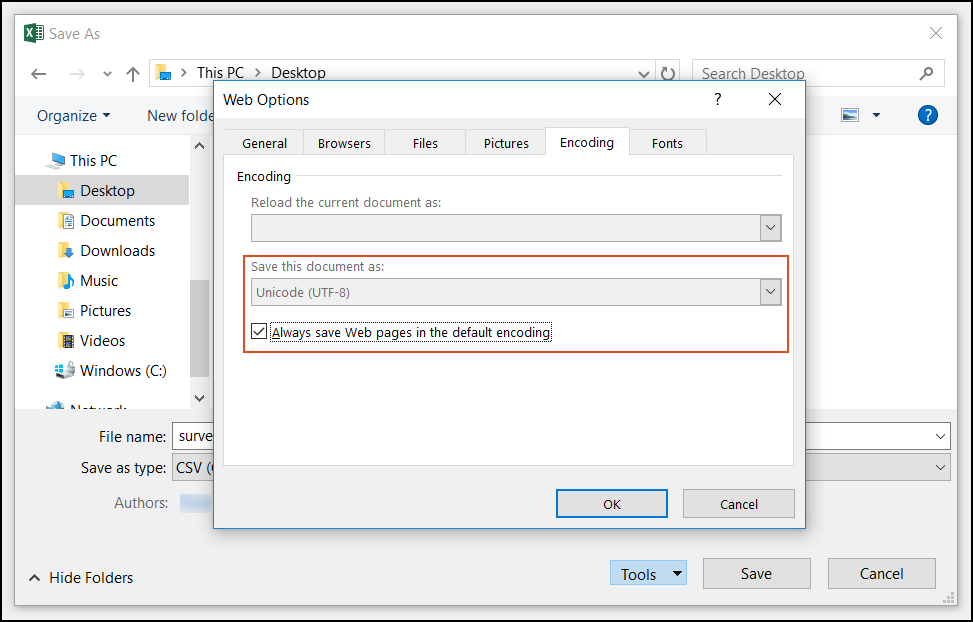
-
Select More Options.
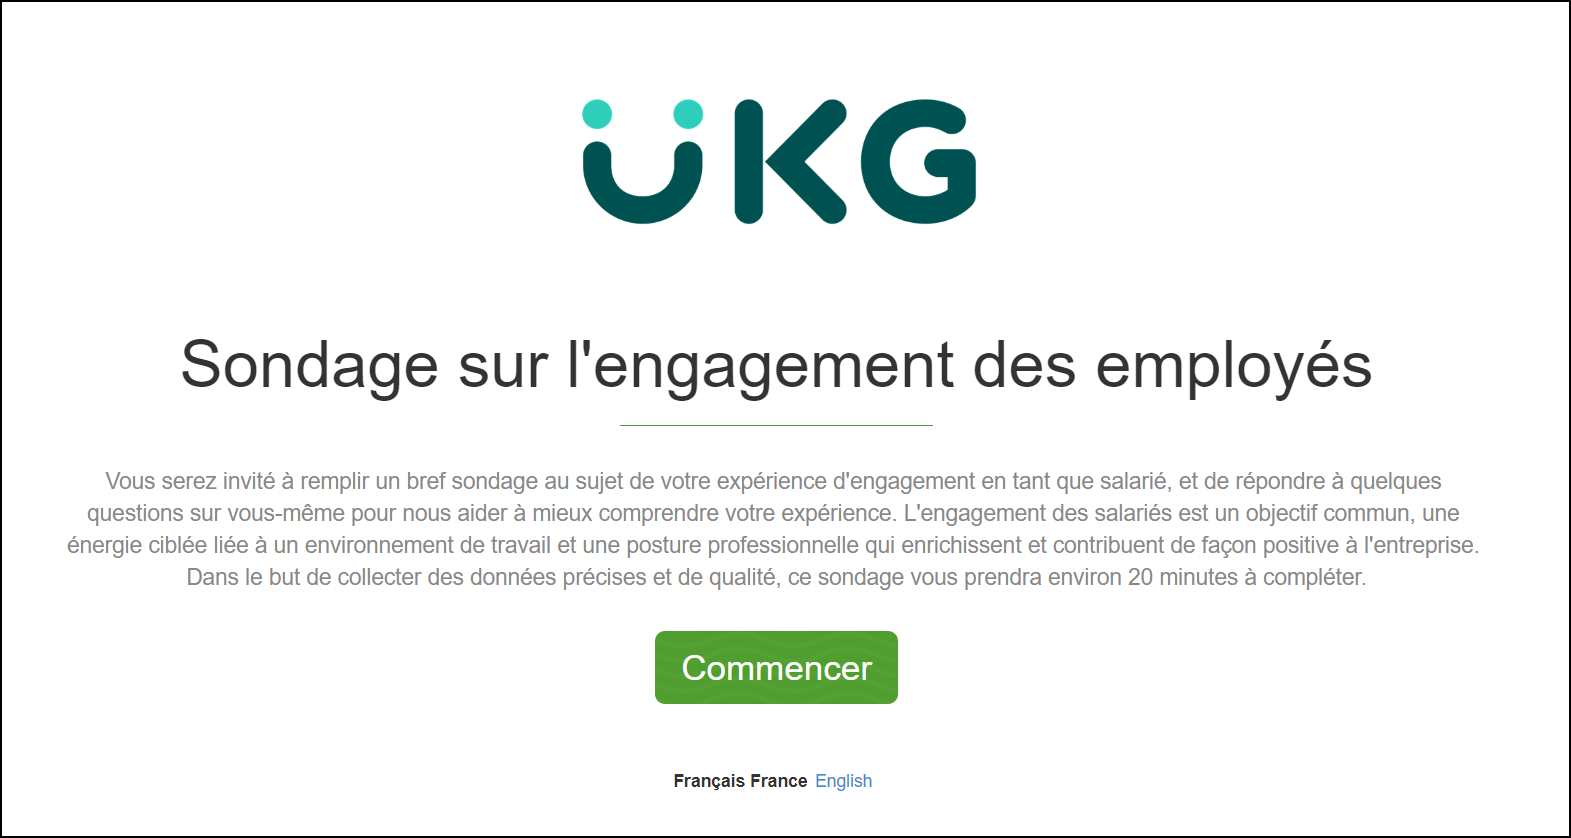
View Translated Survey
To view the translated survey:
-
In the survey footer, select a language.
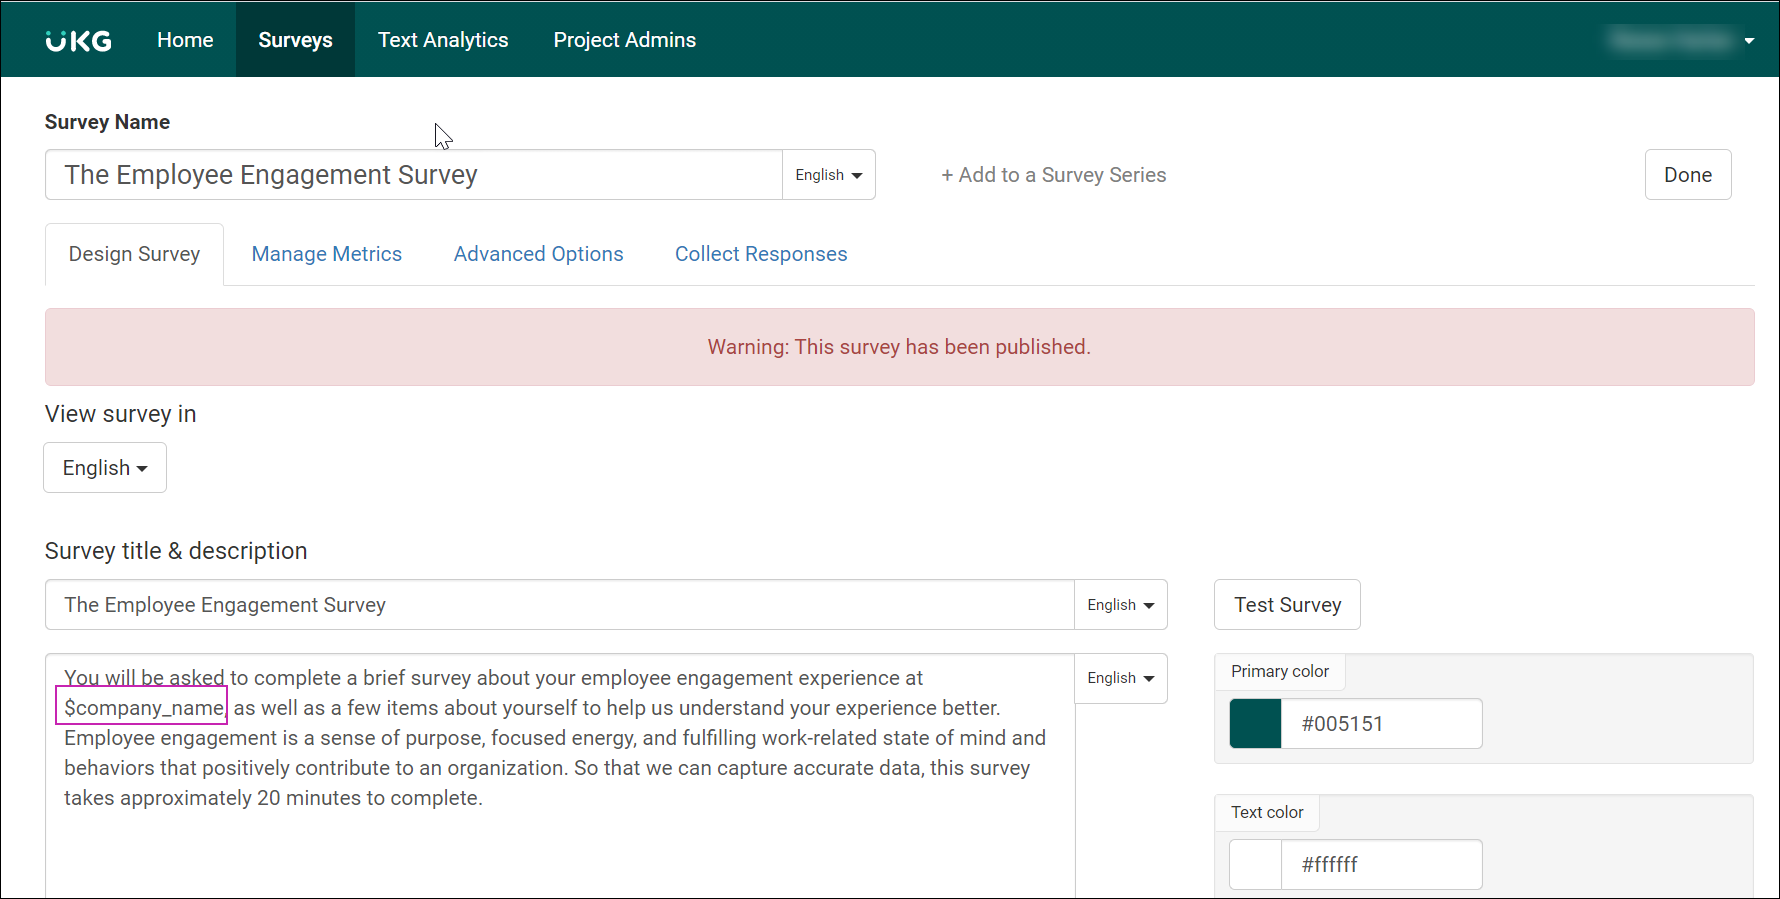
Configure HTML Variables
HTML variables can be used in surveys to personalize survey text.
- $first_name
- $last_name
- $manager_name (based on Manager ID)
- $company_name (based on the company name configured in Account Settings)Note Variables are case sensitive.
- Survey Description
- Page Description
- Question Prompt
- Question Optional Instruction
- Goodbye Messages
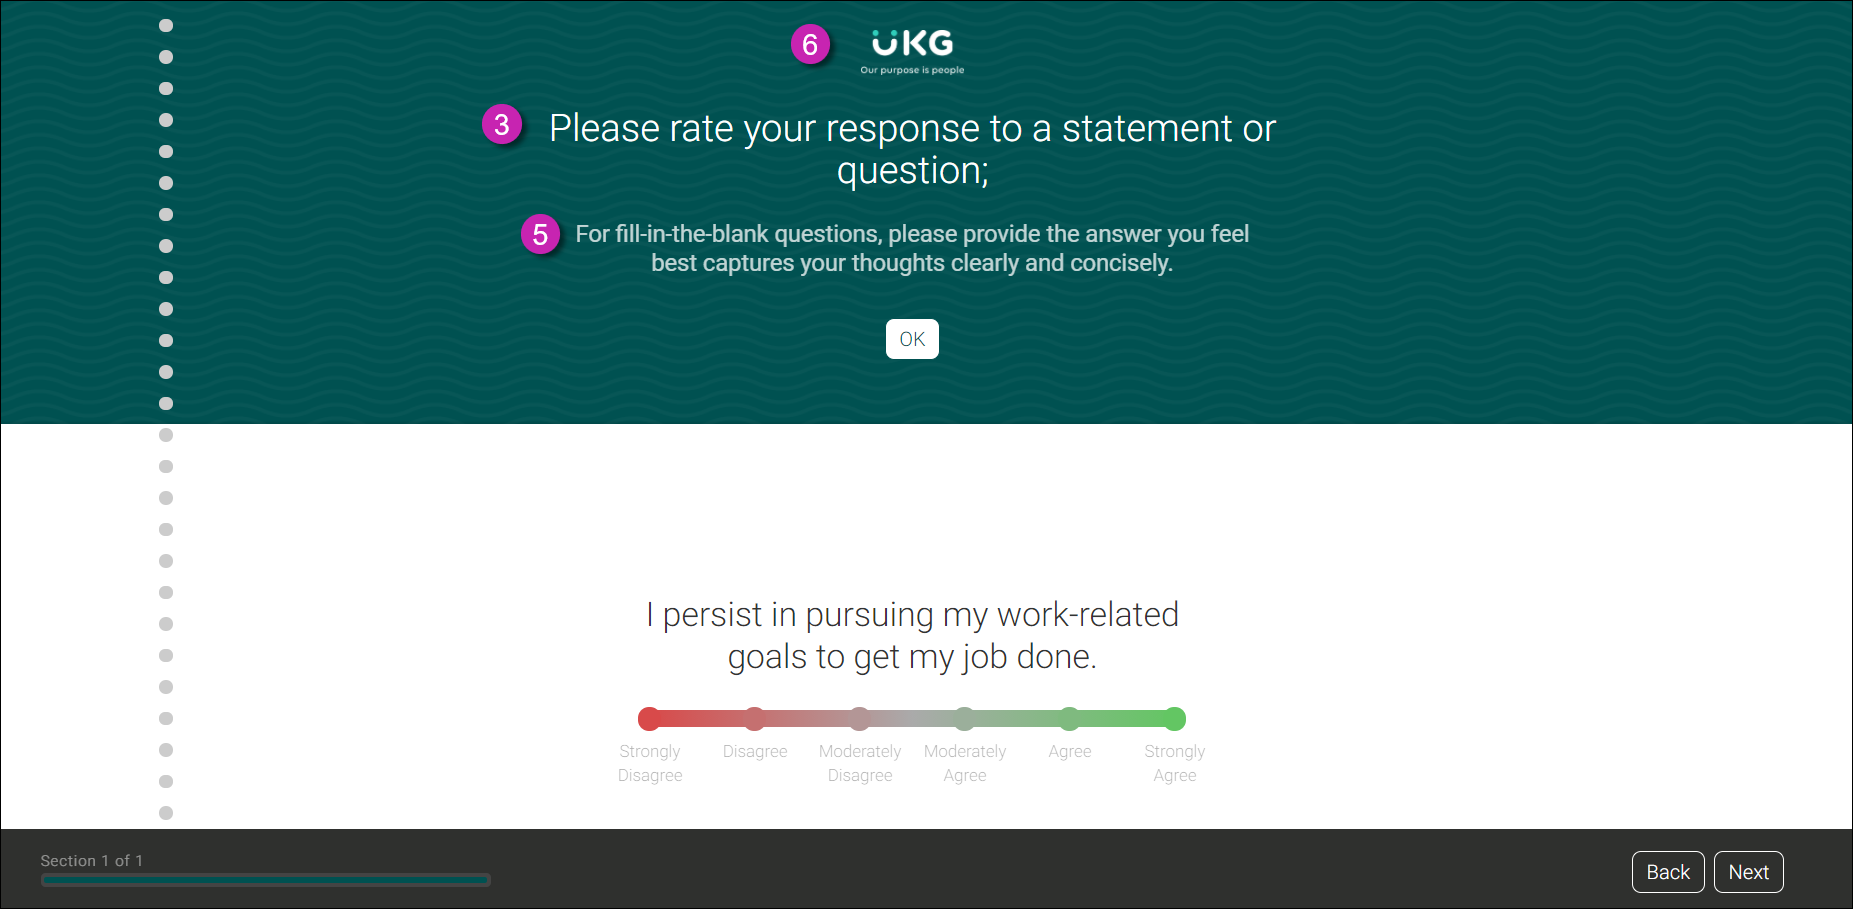
- Buttons (ok, Next)
- Rating Scale Labels (Strongly Agree, Strongly Disagree)
- Multiple Choice Options
- Ranking Question Choices
© UKG Inc. All rights reserved. For a full list of UKG trademarks, visit www.ukg.com/trademarks. All other trademarks, if any, are the property of their respective owners. No part of this document or its content may be reproduced in any form or by any means or stored in a database or retrieval system without the prior written authorization of UKG Inc. (“UKG”). Information in this document is subject to change without notice. The document and its content are confidential information of UKG and may not be disseminated to any third party. Nothing herein constitutes legal advice, tax advice, or any other advice. All legal or tax questions or concerns should be directed to your legal counsel or tax consultant.
Liability/Disclaimer
UKG makes no representation or warranties with respect to the accuracy or completeness of the document or its content and specifically disclaims any responsibility or representation for other vendors’ software. The terms and conditions of your agreement with us regarding the software or services provided by us, which is the subject of the documentation contained herein, govern this document or content. All company, organization, person, and event references are fictional. Any resemblance to actual companies, organizations, persons, and events is entirely coincidental.
Links to Other Materials: The linked sites and embedded links are not under the control of UKG. We reserve the right to terminate any link or linking program at any time. UKG does not endorse companies or products to which it links. If you decide to access any of the third-party sites linked to the site, you do so entirely at your own risk.